
Tushar Chande developed Aroon Oscillator in 1995 as part of the Aroon up and down Indicator system. Tushar’s plan for the system was to highlight short-term levels trend changes. Aroon in the Sanskrit language means “dawn’s early light.”
The Aroon Oscillator is a lagging technical indicator. Aroon indicator values forms of the period oscillators to measure the momentum of a trend & chances that the trend will continue or even help you anticipate trend reversal.
Important aspects of Aroon up and down indicator
- Aroon up line and Aroon down line are used to create Aroon oscillator
- The Aroon measures the number of periods since the last 25-period, low or high.
- The Aroon Oscillator drops below the zero line when the Aroon Down moves below the Aroon Up oscillator. It crosses above the zero line when Aroon Up moves above Aroon Down.
Know aroon oscillator more practical way
A reading above zero indicates that the price is currently in an upward trend, while a reading below zero indicates that it is in a downward trend.
Aroon crossover
Traders look for zero line crossovers to find signal . The Aroon indicator trading system includes the Aroon Oscillator, the Aroon Up MA and the Aroon Down MA. The Aroon Oscillator signals changes in trend direction by measuring the difference between the closing prices of the Aroon Up and Aroon Down MA. The Aroon Up MA reflects the increasing trend, while the Aroon Down MA reflects the decreasing trend.
Aroon indicator formula
The lines for the up and down average must be estimated. The indicator has 25 periods, but the time period is flexible. You can apply more periods if you want a stable indication. You can use more frequent periods to produce more waves. Between -100 and 100 this indicator moves. A high value indicates a bullish trend & a low value indicates a bearish trend. Between 0 and 100, Aroon Down and Aroon Up move.
The stronger the trend, the higher the value will be shown by aroon. A price that reached historic highs a day ago has an Aroon Up value of 96. A price that hits all-time lows a day ago would have a moving average of 96. The lows and highs applied in the calculation help create an inverted liaison among the two indicators. If the Oscillator’s upper rate increases, the Down value will decrease. The value of the oscillator increases when it reaches new highs.
The lower the oscillator value is, the stronger the oscillator’s down value. When viewing a chart, the Aroon Oscillator-line can be included or removed. Switching in the direction of the indicator can help single out a trend. The rate of change is different from the arroon. The latter tracks the momentum by looking at lows and highs and how far the price moves relative to a previous price, while the former tracks if a 25-period high or low occurred recently.
Download Aroon up and down indicator MT4
Is it possible to use the Aroon up and down indicator like any other indicator in the mt4 platform? No, the answer is a big no, as the Aroon indicator doesn’t come with the default MT4 indicators, but it can be downloaded from this link I am providing.
Aroon indicator day trading strategy
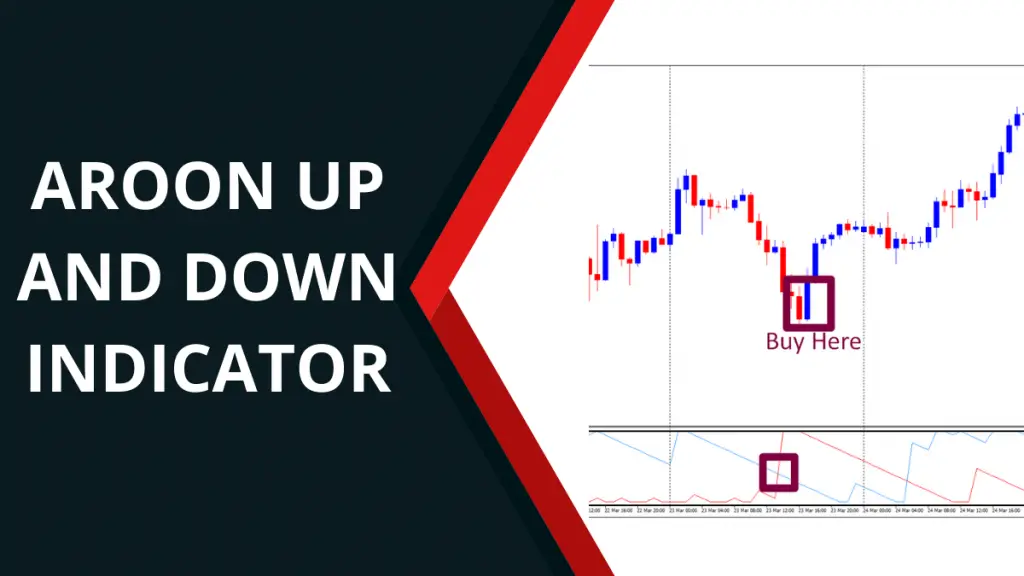
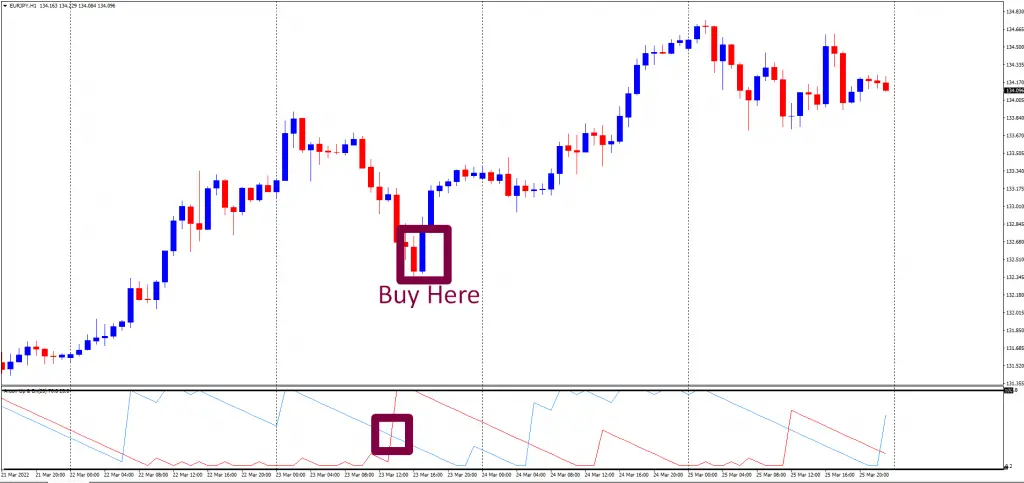
Aroon signal (buy) :
It’s a good time to buy when the blue line rises from the bottom, and the red line is near the middle of the range.
when to sell :
You should sell whenever the blue line falls down and the red one is in the middle of the range
Take profit
If you use the aroon indicator strategy to take trades, then for major and trendy pairs like EUR/USD, GBP/USD, EUR/JPY, USD/CAD, USD/CHF, use 60/70 pips profit target. For choppy pairs like NZD/CHF, NZD/CAD, AUD/CAD, AUD/CHF, use 40/50 pips profit target.
Stop loss
Use no more than 40/50 pips stop loss.
Time frame
For day trading use 1 hour time frame.
Know the Drawbacks of the Aroon Oscillator
This indicator keeps traders in a trade when a long-term trend is developing. The price keeps the oscillator above zero by making new highs. Aroon oscillator can provide you repaint and bad signals as the price and the oscillator move randomly. It may appear when it’s last-minute to use. When a trade potential forms, the price could shift away from an appropriate entry zone or it could be due for a retrenchment. A number of periods is subjective. There is no testimony that the past 25 candlestick periods guarantee a new trend. It is better to use multiple confirmations as periods work best when combined with chart pattern analysis like double top double bottom pattern ,head and shoulder pattern.
Aroon indicator VS rsi
Both Indicators work great. RSI, however, is ideal for divergence trading, and Aroon is great for momentum trading, RSI trails price best because its closes are more weighted on price and gives a relatively straightforward image on overbought and oversold price levels whilst Aroon up and down indicator is based on more the momentum in price.
Aroon up and down indicator vs ADX indicator
The ADX indicator uses an advanced and complicated formula to smooth out an indication of momentum in price. Unlike the Aroon, it is less reactive because it is weighted on the closing of price periods. The ADX is suitable for trend direction analysis. You can pair both indicators to create a trading strategy where ADX is used to analyse trend direction. Aroon is used for price momentum anticipation.
Conclusion
The Aroon is a great tool to measure price momentum. Using a market direction indicator or some advanced level custom indicators like 3 level zz semafor indicator can increase its efficiency. No indicator is 100% accurate, but pegging it with multiple indicators and creating a strategy will increase your chances of finding solid trade setups and maximising your profits.