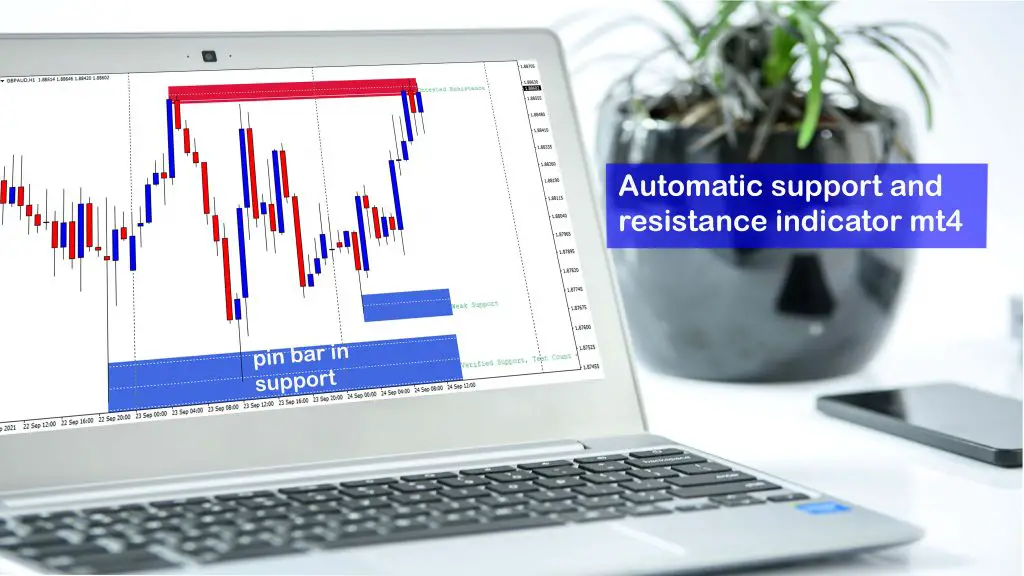
Not only noobs but many professional traders search for automatic support and resistance indicator mt4. But We all know that no such indicator in the mt4 platform or mt5 terminal would naturally draw support and resistance areas.
But today, we will discuss such an auto indicator which will draw the levels automatically and solve our problem. I will give automatic support and resistance indicator mt4 completely free here and share a strategy for trading profitably using this one.

What Are Support and Resistance?
Resistance and support are the price zones. Price always tends to bounce or stagger in these areas. These zones are tough to break.
We forex traders could easily spot these levels by focusing on closing the candle’s current price and checking where they tend to stop and bounce.
Calculating these levels mathematically is a very complex system and a whole long story. We will discuss that another day.
This indicator shows a range of candles where the price is struggling or quickly gone through. Finally, it will work with the mean value and draw some horizontal s/r zones or horizontal lines in the chart.
Why we chose auto support and resistance indicator over manually drawing process
If you are a novice trader, then you are not expert enough who can draw correctly. And if you draw support/resistance levels wrongly, then the chance is higher that you will enter the market with the wrong data. This is because you will enter long where there is no buyer interest, and you will enter short where there is no seller interest in the market.
And if you are a professional one, although you are expert enough to draw the levels correctly, you won’t get enough time to pull them manually. So only automatic support and resistance lines can help you save your precious time.
Automatic support and resistance indicator mt4 explained
automatic support and resistance lines include the fractal indicator. It represents the extreme fractals points of the market.
If the fractals are far away from one another, then the height of support and resistance will be greater. However, if the fractals remain close to one another, then support and resistance stronger levels will remain tight, and the distance will not be too high.
Resistance levels will be shown here with red color, while support will be represented by blue. These red and blue colors will plot the most crucial support and resistance areas.
In short, We will call the red color as seller zone and blue color as buyer zone.
Features of Automatic support and resistance indicator mt4
Do you know Which indicator is best for support and resistance? I will suggest this one. If you ask why then just take a look at the features it has.
automatic support and resistance indicator mt4,mt5 includes the following features:
- Automated algorithm.
- Work with different timeframes.
- Sensitivity adjustment.
- Distance to next support and resistance levels.
Trading rules
First, we will run this automatic indicator in our mt4 or mt5 chart then. Next, we will wait for the price to go near our support zone or resistance zone. If the price comes to the support zone, we will wait for the rejection candle or pin bar candle. If we find a bullish pin bar, then we will open a buy trade.
Stop loss: our stop loss always will be just below the support key level
Take profit: our take profit target will be a 1: 2 risk-reward system. This means if we risk 30 pips, then we will take 60 pips as our target.

For the sell setup, we will wait for the price to come to the red zone or resistance price level. Then we will search for any bearish pin bar or rejection candle. If found, then we will open a sell trade.
Time frame: I will recommend using this indicator on the 240 minutes chart.
Stop loss: our stop loss always will be just above the resistance level.
Take profit: our take profit target will be a 1: 2 risk-reward system. This means if we risk 30 pips, then we will take 60 pips as our target.
Currency pairs: Trade 28 most traded currency pairs only. No exotic pairs and no local pairs are recommended with strategy.
support and resistance indicator mt4 free download
Although there are many resources online promise to give this indicator free but hardly any work smoothly. I write a whole content about the key features of this indicator, positive sides, negative sides. Read this content attentively and you will be able to know the usage of this indicator properly.
Just click the link support resistance indicator mt4 download and enjoy this superb indicator completely free
How do you add a support and resistance indicator in MT4?
To install the MT4 Support and Resistance Lines Indicator, please follow the instructions below:
Download the indicator ex4 indicator file.
Open the MetaTrader 4 data folder (via File→Open Data Folder).
Open the MQL4 folder.
Copy all the folders from the archive directly to the MQL4 folder.
Restart MetaTrader 4 . That’s it now; your auto indicator folder will start to work smoothly.
Which is the best indicator for MT4?
Although there are many default indicators like rsi, stochastic, Bollinger bands .but if you ask yourself,” Is there an indicator that shows support and resistance?” the answer will be a big ‘no.’
No default indicator shows support and resistance levels. That’s why we need to customize it. if you go deeper and trade advance levels, then you should go for any custom indicator like this one
Final talk
This dynamic support and resistance indicator mt4,mt5 combined with candlesticks pattern could be a robust system for technical analysts. Many search “Support and resistance indicator mt4 2020” because this indicator was very popular in 2020. However, a year is just a number. The appeal of this indicator has no less; rather still, it remains the best support and resistance indicator mt4 in 2022, and its popularity will increase in upcoming years undoubtedly. Experienced traders and institutional traders recommend that all retail traders should have this tool as their main trading weapon.
Some more strategies like Automatic support and resistance indicator mt4 using custom indicators
- Secrets to accumulation/distribution indicator mt4
- How to trade forex using 1 2 3 pattern indicator
- Auto fibo trade zone indicator for 2022
- Non repaint reversal indicator mt4 free download
- The Reasons Why We Love Average Daily Range Forex indicator
- 3 level zz semafor indicator for 2022
- 3 ducks trading system for 2022
- 2 line macd indicator for mt4
- Best currency strength meter for 2022
