Stochastic is one of the well-known oscillators that has been used in trading for several decades. Many other modifications have been created based on this tool, and one of the most common versions is the Color Stochastic indicator.

Description of Color Stochastic indicator
The color stochastic works on the same principle as the old & classic one. It compares the price values of candles for a given period. The colored stochastic shows the conditions when a currency becomes overbought or oversold and determines the trend’s direction.
Structures and signals of Color Stochastic indicator
Color Stochastic displays two curved lines on the panel – a fast MA (%K line) and a slow MA (%D line). Their intersection indicates a high probability of a price reversal on the chart. That’s why many call it a divergence indicator.
The lines are located on the panel in the terminal basement and move in the range from 0 to 100. Levels 20 and 80 are the boundaries of the oversold and overbought levels.
If the oscillator lines have risen above the level of 80, then this means that the price is overbought. The uptrend has peaked. However, it is too early to talk about the reversal itself. It will be possible to speak about a change in the trend at the moment when the lines break through the overbought border from top to bottom and continue to fall. Immediately after the breakdown, you can open a short trade.
If the stochastic curves fell below the 20 lines, this indicates an oversold condition. The downward trend has peaked. But this situation is not yet a reason to open a new trade. It will be possible to enter a long position only after the Stochastic lines turn around and break through the level 20 in the opposite direction – from the bottom. We recommend that you study different ways to filter the stochastic to filter out false signals and improve trading quality.
Color stochastic – download for MetaTrader 4
By default, only the regular version of the indicator is built into the terminal. The color stochastic needs to be downloaded and installed manually. Download color stochastic indicator mt4 form here.
Color stochastic mql4 Installation instructions
- Open a terminal and find the “File” menu.
- Select “Open data directory” and go to the MQL4 => Indicators folder
- Paste the file that you downloaded just now.
- Reload the mt4
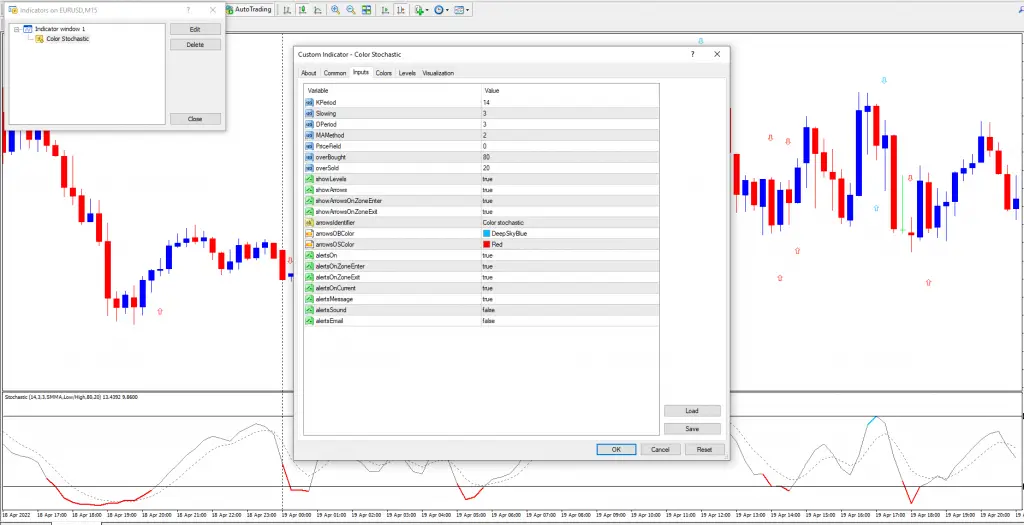
The main settings of the indicator remained unchanged. The trader can still set the indicator’s values for the %K and %D moving average, slowdowns and levels. At the same time, new parameters have been added. Now you can fully customize the color scheme of the indicator, add different types of alerts, etc. The figure below shows an example of a window with input parameters settings.

What features does the color stochastic have?
The forex indicator gives exactly the same signals as a regular stochastic oscillator. The only difference is in their visual design. When a signal arrives, the color of the main stochastic line changes
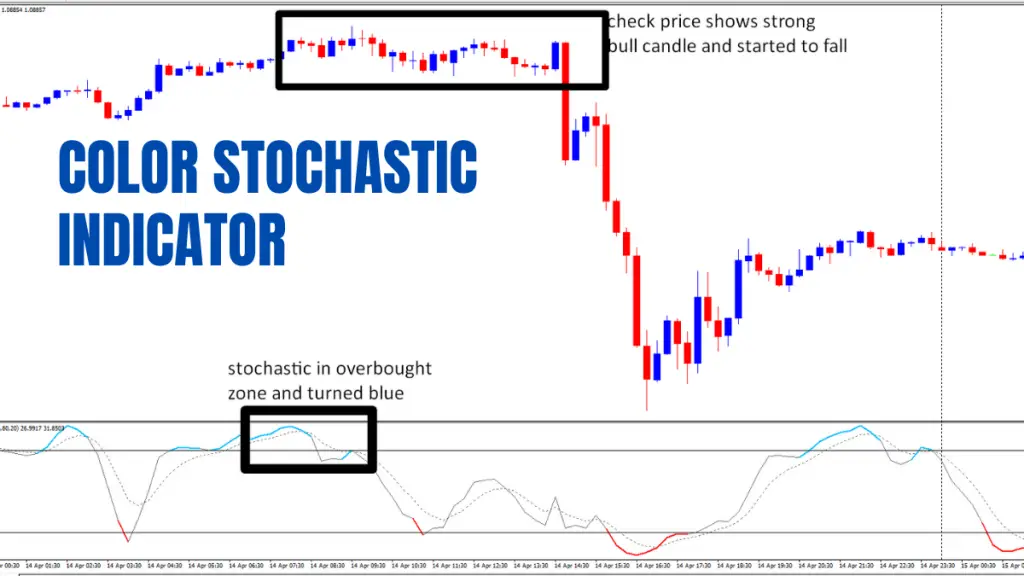
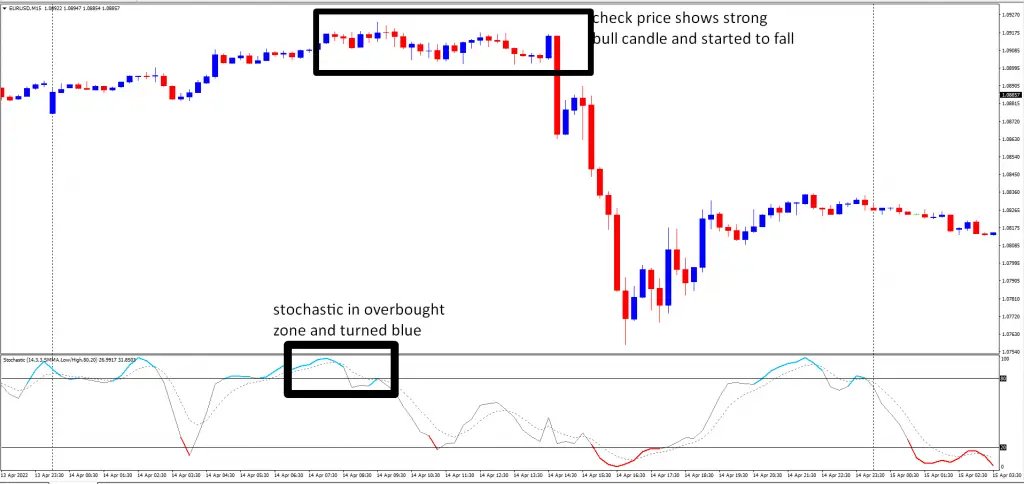
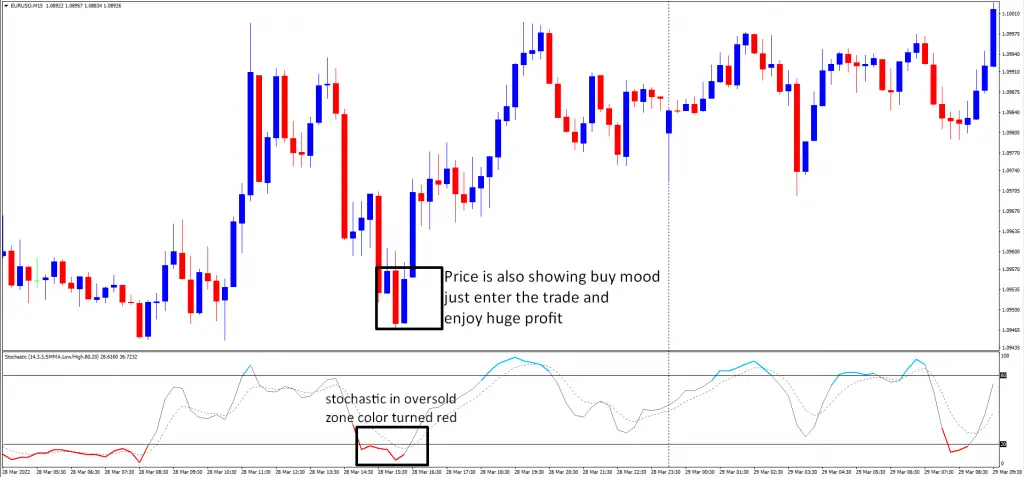
The moment the stochastic enters the oversold zone, the line turns red. When the stochastic oscillator enters the overbought zone, the line’s colour changes to blue.
In addition to changing the color scheme, signal indicators in the form of arrows were also added to the chart. They appear at the moment when the main curve changes color when a signal is received. The down arrow indicates a sell signal, and the up arrow indicates a buy signal.
We also recommend testing other interesting stochastic modifications, and getting acquainted with their signals and features.
A simple strategy based on Stochastic Color and Macd
This forex trading system is based on the signals of two instruments – stochastic and MACD. Algorithm settings are standard; Stochastic levels are 20 and 80. Chart time frame – M15, currency pair – any to choose from.
Entry into a short position is carried out on the following signals: The stochastic lines entered the overbought zone; the main moving average turned blue. The MACD histogram starts to fall.
You need to buy the market after the oscillator lines break through the level of 80 from top and the signal candle on which this breakdown occurred closes. Stop-loss is placed beyond the near maximum. Buy and sell signals are shown in the screenshot below.

Trade management of color stochastic indicator sell setup
The stochastic lines broke through the 50 mark from top to bottom – a conservative approach to trading. Less risk and lower profit. Stochastic curves have reached the border of the oversold zone – a risky approach since the trend does not always reach such a peak. More profit and higher risks.
Entry into a long position is performed on the reverse signals:

The curves of the oscillator crossed the border of 20 from top to bottom; the main moving average became red. MACD’s histogram Starts to rise.You can open a buy order after the oscillator leaves the oversold zone. Protective SL is placed behind the minimum.
Profit is fixed on one of the following signals:
Stochastic has broken through level 50 upwards – conservative trading. Stochastic has reached the border of the overbought zone – a risky approach.This forex trading strategy is suitable for beginners, as it has simple rules for entering the market and settings. To filter out signals on the main trend, you can add SMA or EMA moving averages to the chart with a period of 50, 100 or 200, depending on the working time frame.
Pros and cons of color stochastic indicator
Opinions about color stochastic technical indicator vary. Some traders consider it an absolutely unnecessary innovation and prefer to trade on a classic instrument. Other users, on the contrary, treat it as a convenient addition and use it instead of the usual stochastic.
The figure below shows an example of oscillator signal indicators. The mt4 indicator sometimes gives false signals, especially during powerful trend movements when the oscillator lines “stick” in one of the critical zones. Contrary to the standard rules that a reversal should begin soon, this does not happen during a strong trend, and the price continues to make chart highs/lows.
Such situations need to be tracked, so the stochastic is never used alone. To filter its signals, you need additional indicators or other trading tools. The tool also has its advantages. The color stochastic gives clear signals, and sends sound and other alerts about changes in the market situation. The indicator is best suited for trading within the corridor, when the price periodically bounces either from the support line or from the resistance line. Stochastic can easily identify such fluctuations and signal a new price reversal. The main thing is to specify the correct billing period in the settings.
Conclusion
Custom indicators are not bad always. However, many think that fancy faulty custom indicators harm newcomers. But the actual fact is that not all the custom indicators are bad. If you have a custom indicator like color stochastic indicator and know how to trade using this indicator, then trading will be fun.
