
What is macd indicator
MACD is the short form of moving average convergence divergence. Traders use the MACD indicator to detect a new trend. Whether it is bullish or bearish, it doesn’t matter; MACD indicates both trends.
As a trader, there is no doubt that you often hear that “trend is your friend.” A considerable profit is made in a trending market, so everyone wishes to find out whether the market is trending mood or choppy mood. MACD can help you figure out whether the market is trending !
How to use MACD indicator in trading
You can use MACD in 3 different ways to generate trading opportunities and trade profitably.
- MACD crossover strategy
- MACD divergence strategy
- MACD with RSI strategy
MACD crossover strategy
MACD moving average crossover strategy is very popular among traders. Traders find trades when the MACD line or faster moving average crosses above the slower moving average or signal line. Many traders call it as macd golden cross.
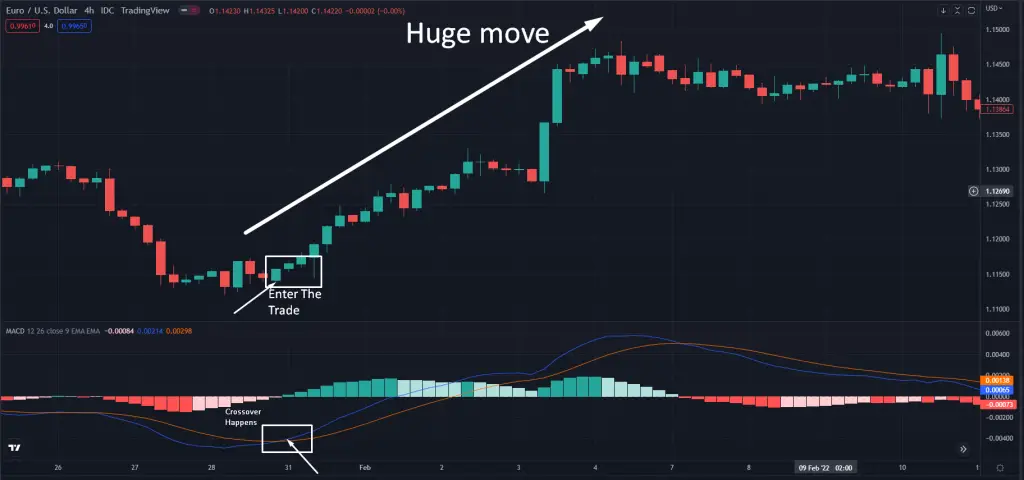
Look at the picture. Fast moving average or green line crosses the dark yellow line (signal line). Also, the histogram becomes green. This is a true sign that a new trend is about to happen. If you buy here, you can catch the trend from the beginning. Next, we see that there is huge buying pressure in the market.
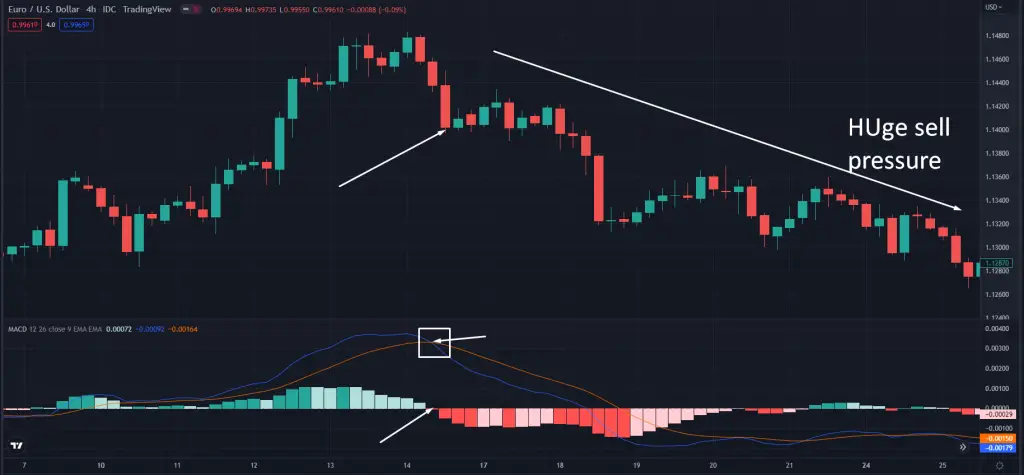
Here is another example. But this time, it is a sell trade. MACD line or fast moving average crosses slow moving average or signal line. Also, the histogram is becoming red. You can predict that the market is changing its direction from buy to sell. If you are a smart trader, you will open a sell trade seeing a big bearish candle. And if you do that, you will be able to exit the trade with a huge profit. We see here market gives us so many pips in this single trade.
MACD divergence strategy
If you find MACD indicator forms highs and lows which diverge from the price data or the price’s highs and lows, that is divergence.
MACD Bullish divergence
If you find two rising lows in the MACD indicator but two falling lows in the price, then that is a bullish divergence. Take a look at the following picture.
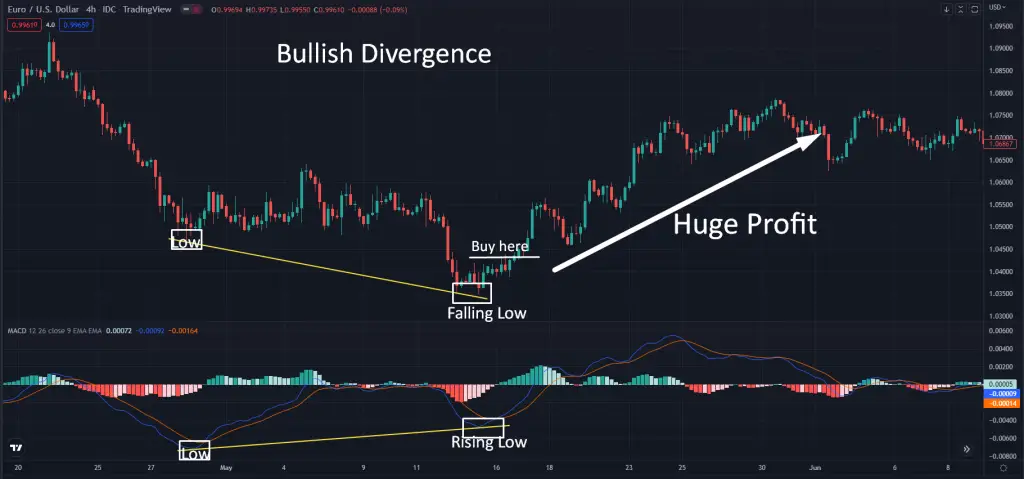
Here, you find Low and then rising Low in MACD indicator, but Low and then falling low in price. From this data, you can conclude that a bullish divergence is about to happen. When you find such types of setup, then don’t delay. Take a buy trade, and you will make a huge profit. Look how beautifully the price rise then. Those who took this trade for sure made a huge profit.
MACD Bearish divergence
If you find two falling highs in the MACD indicator but two rising highs in the price, then that is a bearish divergence. Take a look at the following picture.
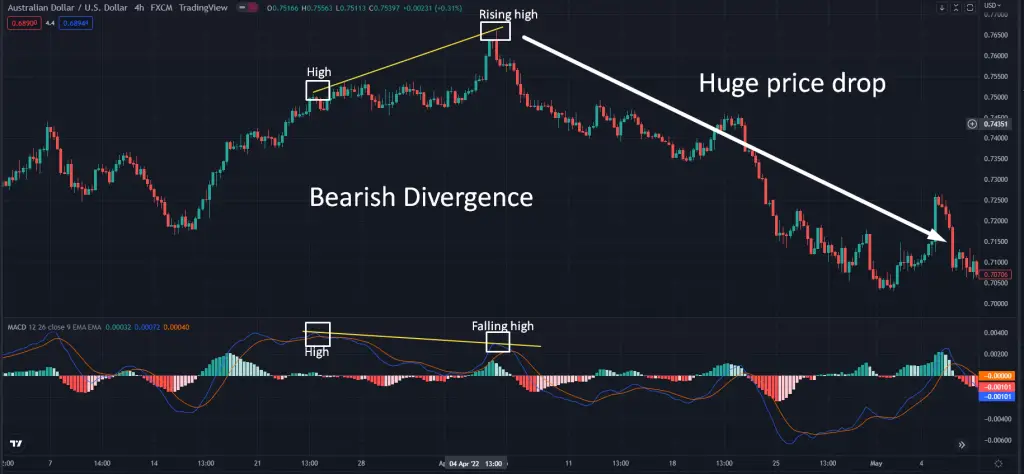
Here, you find high and then falling high in the MACD indicator, but high and then rising high in price. From this data, you can conclude that a bearish divergence is about to happen. When you find such types of setup, then don’t delay. Take a sell trade, and you will make a huge profit. Look how beautifully the price fell then. Those who took this trade for sure made a huge profit.
MACD with RSI strategy
Many traders want to know how to use macd indicator with rsi. Here is the secret for you. Never try to compare these two indicators like macd vs rsi. Which one is best? Remember, these two indicators are different in use, so comparing them is foolish. Rather than combine the RSI indicator with MACD, your macd signal will undoubtedly be more vital.
How to read macd and rsi
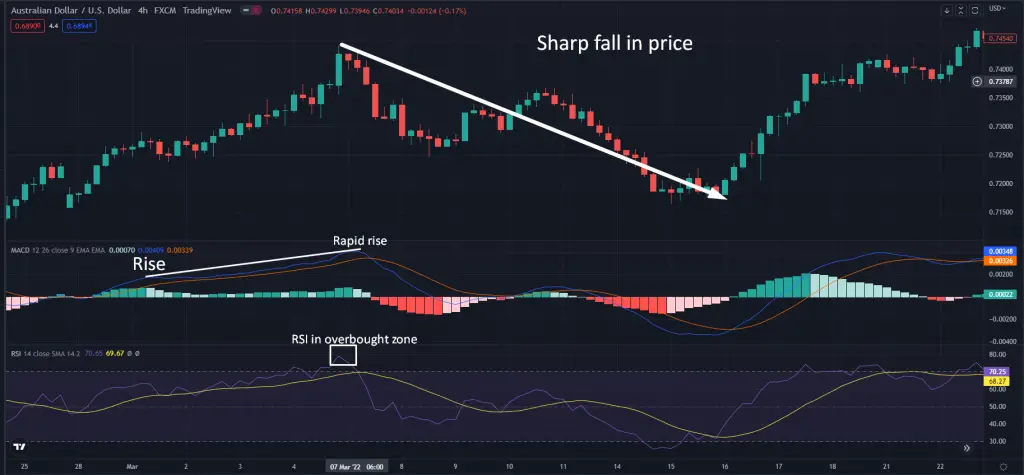
You can take a sell trade when you find a rapid rise in the macd indicator, and rsi is also in the overbought zone. There is a huge chance that the price will fall. And if the price fall, then it will fall sharply. Look at the following picture where macd rise rapidly, and then we check our rsi indicator. Rsi is also showing that the price is in the overbought zone. The outcome is in front of you. Price fall drastically.
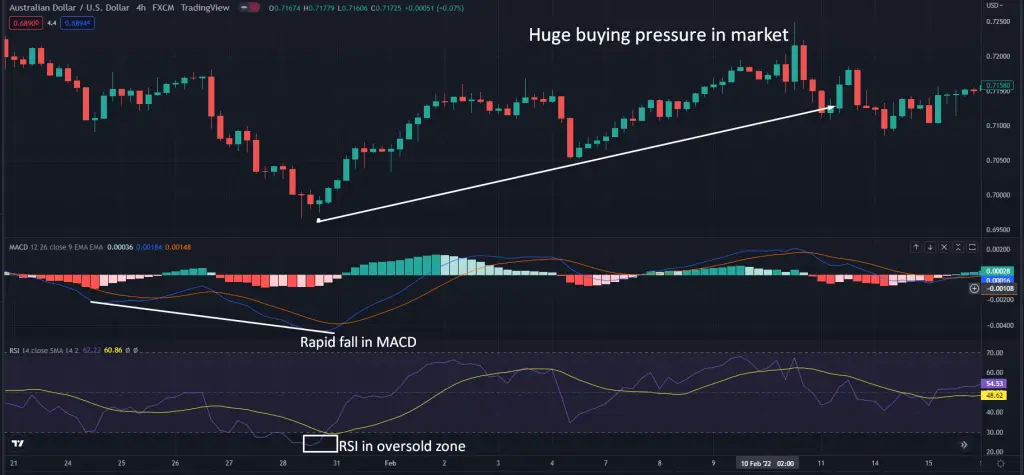
You can take a buy trade when you find a rapid fall in the macd indicator, and rsi is also in the oversold zone. There is a huge chance that the price will rise like mad. Look at the following picture where macd falls rapidly, and then we check our rsi indicator. Rsi is also showing that the price is in the oversold zone. The outcome is in front of you. Price rise drastically.
How to read macd
If you subtract the 26-period exponential moving average from the 12-period exponential moving average, then you will get the value of MACD. There are 2 lines in MACD. One is the MACD line, and the other is the Signal line. In a MACD chart, you usually see three numbers. 12,26 and 9. 12 is for an exponential moving average of the last 12 bars or candles. This is a faster-moving average. 26 is for an exponential moving average of the last 26 bars or candles. This is a slower moving average.
9 indicates the difference between a slower-moving average and a faster-moving average.
Big misconception when read MACD
You know there are 2 lines . One is the MACD line, and the other is the signal line. Traders think that these 2 lines are the moving averages of the price. But it is not the moving average of the price.
Instead, MACD line is the difference between two moving averages. Traders consider this MACD line as the faster-moving average
The other line is the “signal line.” Traders consider this signal line as the slower moving average. This line is the average of the previous MACD lines. At the very beginning, we discuss the 9-period moving average. This signal line is that 9-period moving average. In short, the average of the 9-period faster MACD line is the slower moving average.
MACD histogram
MACD histogram is nothing but the difference between the MACD line and the signal line. Many traders use this histogram as an early sign of crossover. If the MACD line and the signal line get distant from one another, then the histogram’s bars get bigger, and if these 2 lines get closer, then the histogram’s bars get smaller.
MACD divergence
If MACD line or faster-moving average diverge away from the slower moving average or signal line that is MACD divergence.
MACD convergence
If the MACD line or faster moving average converges or gets closer to the signal line or slower moving average, then that is MACD convergence.
Traders don’t know how to read the macd because they fail to understand these basics. If you understand these basic terms of this indicator, then you will find this one very effective indicator.
Some powerful MACD strategy in forex Trading
1 min macd scalping strategy for 2022
1 min macd scalping strategy is a type of trading system which is based on four distinctive technical indicators. These are MACD, 20 EMA,30 EMA and 150 EMA. Experienced traders apply Read More
2 line macd indicator for mt4
Although the macd indicator is found as the default indicator, today I will discuss a custom one which is a 2 line macd indicator for mt4. I will show how Read More
How to use MACD indicator PDF
Many traders want to read a pdf version of the MACD strategy and how one can use this indicator in real trading. For those traders, parkingpips has its very own pdf version. Get it from here.
FAQs
1. Whats is the meaning of macd
MACD meaning is moving average convergence divergence
2. What is the best macd settings
According to our findings, the default settings or 12,26,9 is the best macd setting.
3. What is the macd formula or macd calculation
MACD=12-Period EMA − 26-Period EMA
4. Best macd settings for 1 minute chart
Best MACD settings for 1 minute chart is 8,17,9.