In Forex and binary options trading, indicators are often used to understand which direction the market will move next. One of these indicators is the Donchian Channel indicator. Its developer is America’s famous trader and financial analyst – Richard Donchian. Let us consider in more detail the ways of using this technical indicator and the principles of its calculation and construction.

What is donchian channel formula
The Donchian Channels indicator formula considers data on absolute price highs and lows for the selected calculation period. The upper boundary of the corridor passes through the maximum point and the lower one through the minimum. In this case, all calculations are carried out only within the period specified in the settings.
The settlement period is indicated in candles. For example, the parameter “20” will mean that the data of the last 20 candles on the chart are used to build the channel. This period will be equal to one trading month (excluding weekends) on a daily time frame. This period will be equal to 20 hours on an hourly time frame.
A breakout of the border of such a channel will mean an update of the absolute maximum/minimum for the last 20 days or hours (depending on the time frame). A breakout of the lower band boundary means a new low, and a breakout of the upper one means a new high.
When using the Channel Donchian indicator, choosing the correct value for the calculation period is essential. The instrument’s author, R. Donchian, recommended using a period equal to 20 candles. However, consider that Donchian channel usually traded on the daily time frame. Therefore, when trading on other time frames, the value of the period should be selected empirically.
Donchian channel indicator mt4
You won’t get donchian channel by default in the mt4 terminal. That’s why you need to download the channel from here. Just install it in your meta trader 4 terminal and use it with its default settings.
Donchian channel trading strategy
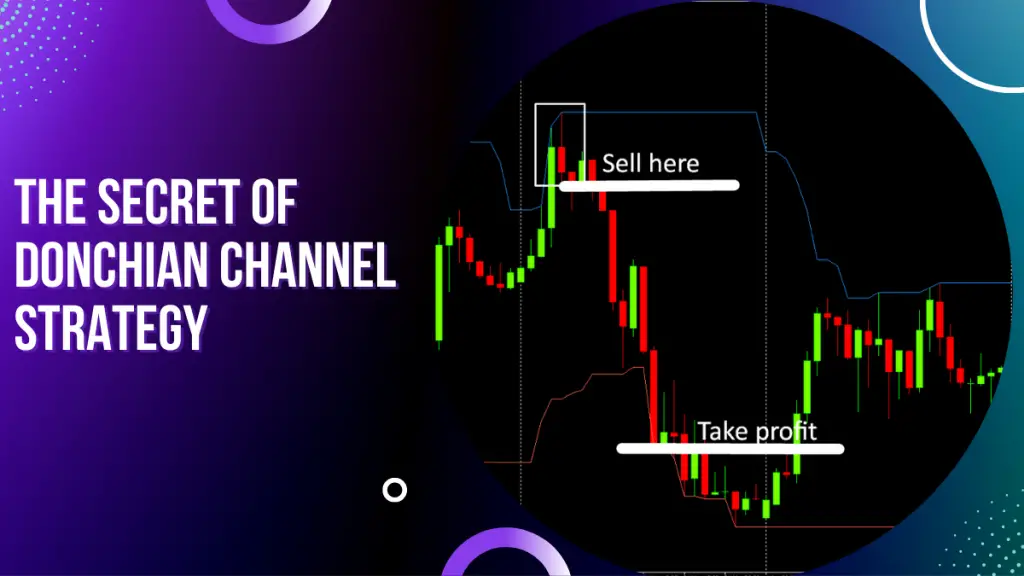
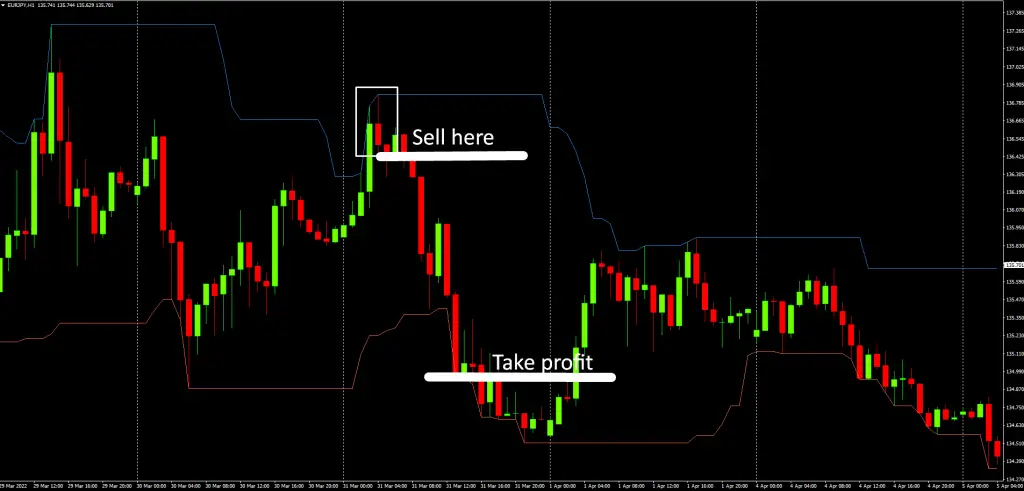
The Donchian channel gives high-quality signals for opening trades. A buy order can be opened when we find any pin bar or candle with a wick in its low in the lower boundary of the corridor. A sell order is placed when any bearish pin bar or candle with an upper wick will form at the upper boundary of the donchian channel.

You need to close orders and take profits at the opposite signal. A buy trade is closed when a Sell signal appears, and vice versa. At the same time, it is important to limit potential losses by placing a protective stop loss for each trade.
How to use donchian channel in pyramiding strategy
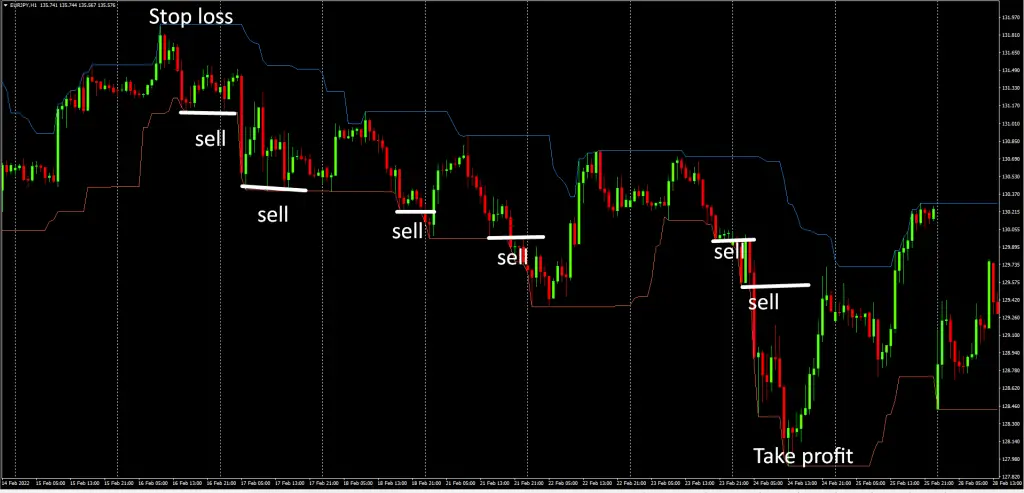
The Donchian indicator can be used when trading the “pyramid” method. The meaning of this approach is to enter the market not with one but with several orders.
If the first order started to make a profit, then you should not rush to close it by taking profit or manually. You need to wait for the moment when the price rolls back in the form of a correction and re-enter the market by placing another order in the same direction. So you can open orders on each rollback as long as this trend continues.
The figure below shows how you can enter the market several times using the pyramiding technique. Sell trades were opened in this case, and a stop loss protected each. In the end, the trader received a good profit from 5 open orders within just one trend movement.

The pyramiding method allows you to repeatedly increase profits, but it also adds risks. In a sharp turn back, the price can break several SL s at once.
Donchian channel scalping with stochastics
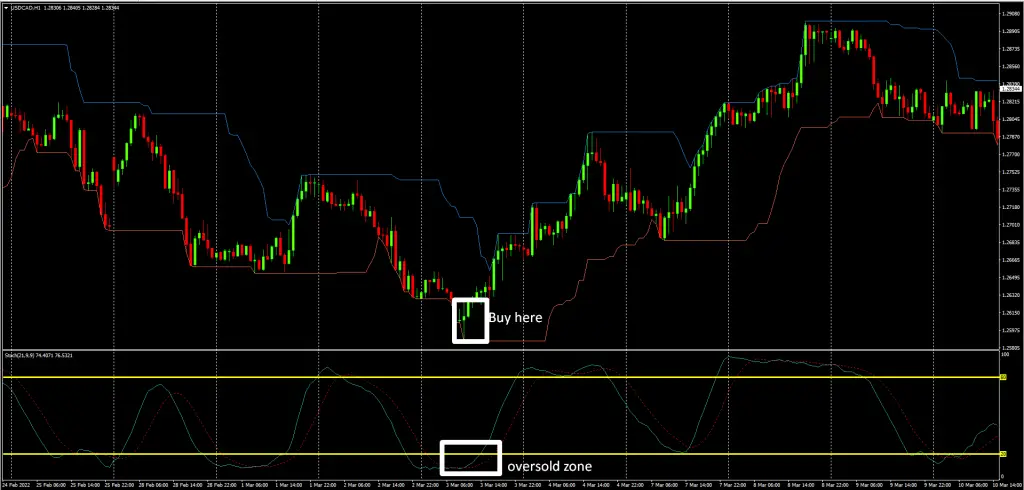
The essence of this strategy is to open trades when the price bounces off the upper/lower border of the Donchian channel, subject to a confirming signal from the stochastic oscillator.
A buy trade can be opened if the price has bounced off the lower border of the Donchian channel, and the stochastic has left the oversold zone at that time. The intersection of the stochastic curves with each other will be considered an additional confirmation of the signal.

A protective SL for a Buy trade is placed beyond the lower boundary of the Donchian Channel. Take-Profit is at the upper border of the channel.
A sell trade can be entered into if the chart rebounded from the upper boundary of the Donchian corridor, and the oscillator left the overbought area. If the stochastic curves intersect with each other at this moment, then the signal is additionally confirmed.
Stop-Loss to protect the deposit is placed beyond the upper line of the channel. TP is placed on the lower border of the corridor.
Donchian channel vs Bollinger bands
Although Bollinger bands and donchian channel work on different parameters, many traders think they are similar. You can apply the same strategy on both donchian channel and Bollinger bands indicator, but you won’t get the same result. donchian channel works well in trendy markets, while Bollinger bands work well in the choppy market.
More specifically donchian channel breakout strategy is not as popular as the Bollinger bands breakout strategy. So you need to be careful about those two indicators before comparing them.
Conclusion
Donchian channel is like any other technical analysis tool in forex trading. So as there is no indicator in forex, which is 100% perfect, so does donchian channel. You need to know the proper use of this indicator if you want to make money with it. Before knowing proper use, don’t use it in your mt4 chart. Just follow the strategies I narrated this content and apply these in your demo account first. Practising in demo first for a couple of months and then come to real/actual trading world with the real account.
