
Also known as the 5 minutes Orb strategy, the premise of the 5 minute opening range breakout strategy is to look for momentum-driven breakouts out of the opening high and opening low range of the day using the 5 minutes charts.
Traders use momentum-based indicators to assess probabilities of price range breakouts to trade in line with the momentum after the first 5-minute candle is formed. Stock traders commonly use this trading strategy; however, it can be applied to other financial products like the forex and crypto markets.The best validation comes with using a trend indicator with the momentum indicators to create a confluence as the results coming together of both indicators can give the trade a high outcome and put into perspective the previous day’s trend direction.
Best moving average for 5 minute chart
The commonly used indicator for trend validation is the 20 ema, and the rule is if the 5 minutes cross above the 20 ema, then a positive breakout might happen. On the contrary, if the candle closes below the 20 ema, a negative breakout might happen.You can use any other momentum indicator you are comfortable with the 20 ema, but the most commonly used momentum indicator is the volume indicator.
This indicator shows how much volume other market participants have committed a currency or stock. A higher volume will mean that there will be a high momentum towards the direction of the trend, and a medium volume will entail that price might consolidate within the opening range.The 5 minutes orb is a scalping strategy, and a trader will usually use a risk/reward ratio of 1:1 as a risk management strategy to protect themselves in case the breakout fails. It works great on volatile market products.
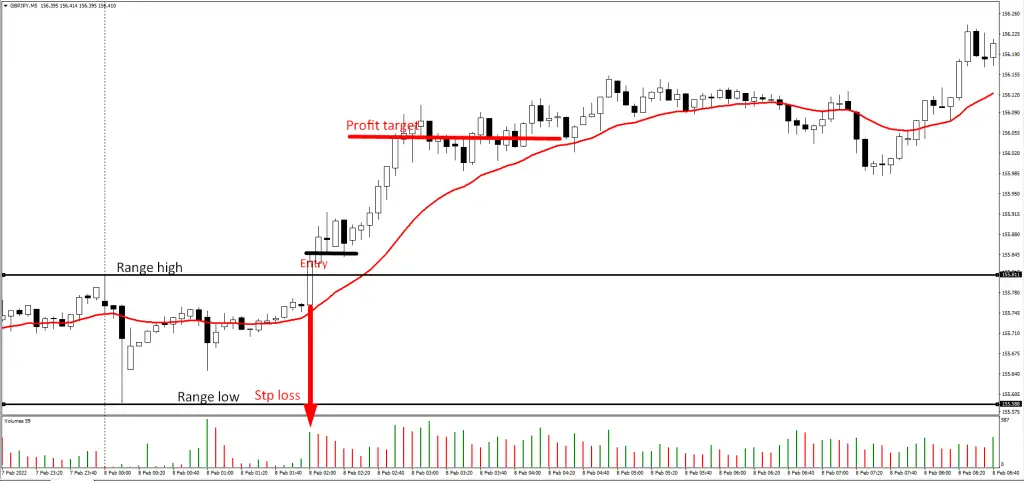
ORB trading strategy Buy rules for day trading
- Look for a price gap during or before the day opens.
- 5 min candle and 20 ema bullish crossover.
- Price breaks past open range high.
- Rising volume on volume indicator.
- Profit target: you should target 1:1 risk-reward as your profit target.
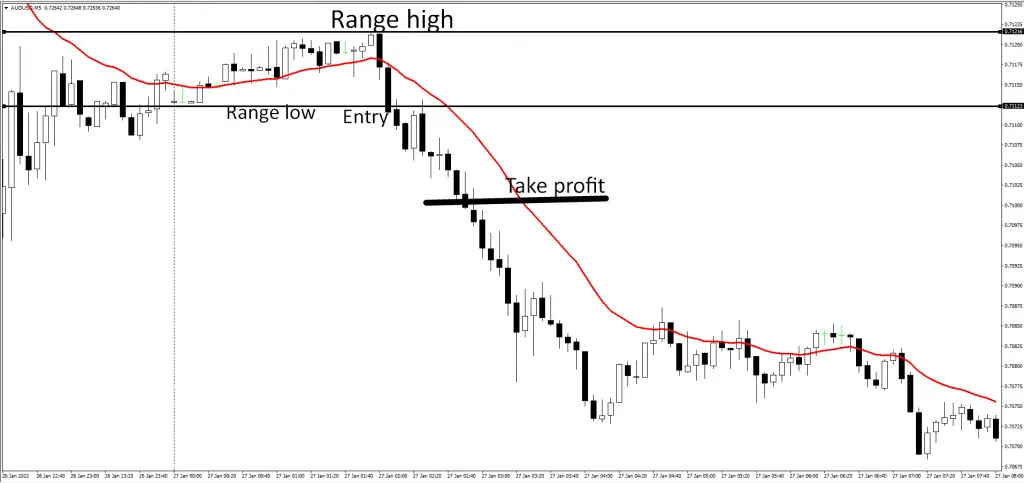
Sell rules for 5 minute opening range breakout trading strategy.
- Look for a price gap during or prior to the day open.
- 5 min candle and 20 ema bearish crossover.
- Price breaks past open range low.
- Increase in volume on volume indicator.
- Upon entry, 1:1 risk/reward ratio, stop-loss order/ take profit order.
Other indicators that is used for breakout momentum
Besides the volume indicator, other indicators can anticipate breakout momentum in future price movement, such as the Stochastic oscillator, Bollinger bands & MACD (Moving Average Convergence and Divergence). Usage of these indicators will be subject to the experience level that the trader has with using The indicator, in line with price action and the 20 exponential moving average.
Advantages of open range breakout strategy
- This is a low-risk strategy.
- Suitable for scalp trading.
- If you look for opportunities on Short term trends, then this orb strategy is for you.
- Trades are executed during low volatility times, Asian sessions.
- Scalp trades can turn into swing trades if good trade management is followed.
Disadvantages of open range breakout strategy
Every technical analysis has more or fewer demerits. And open range breakout system is no different.
- Low reward.
- False breakout
5 Minutes MOMO strategy for Intraday trading
The 5 minutes momo strategy has the same outlook on momentum trading as the 5 minutes ORB or opening range breakout strategy. However, the MOMO strategy looks to capitalise more on intraday reversals of short-term trends, so when using this strategy, traders often look on higher time frames to find key support and resistance before entering a trade on the 5 minute chart. This is key because markets are fractal, and higher time frame setups have more weight than lower time-frame setups.
Indicators
This strategy uses the MACD & 20 ema on the 5 minute timeframe and 50 ema on the 15 minutes or 1 hour to help identify larger trends. The MACD must be left at default settings. If you are not sure what the default settings should be, I will include them in this passage: EMA = 12, EMA = 26, signal line EMA = 9. All should be set to measure candles on close.
The main focus on the MACD is the 0 points, if the oscillator is ascending from the negative to the positive, then we are looking for a bullish reversal of a bear trend, and if the oscillator is descending from the positive towards the negative, then we are expecting to see a bearish reversal from the previous bullish trend.
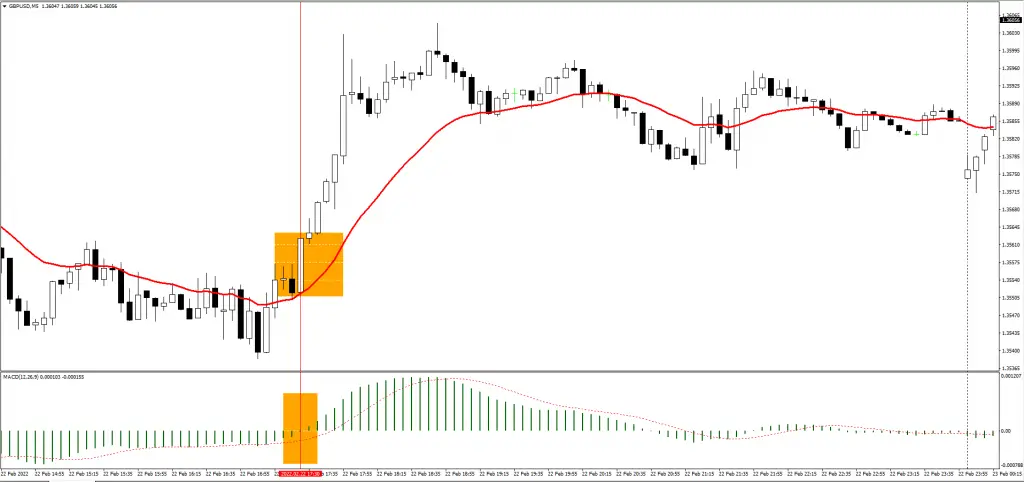
The application of the 20 EMA aligns with the trade entry strategy, the crossover of candles above the 20 EMA will signal a buy entry, and a crossover of price candles below the 20 EMA will signal a sell entry.
Confirm trends on higher time frames
To avoid analysis paralysis(the state of not knowing whether to buy or sell to do erratic price behavior), you will then look at the past three days of price movement on the 1-hour time frame. If in the past three days price has been on a downtrend, then we aim to look for a reversal point so we can start buying the reversal of the downtrend; else, if the price has been on an uptrend in the past three days, then we should look to sell the reversal of the uptrend, this is not written in stone as the price can be on an uptrend or downtrend for longer than three days.
This is where looking for key support or resistance comes in. If a trend persists for more than three days, we then shift our view to find key points where liquidity may be injected or ejected when currencies are overpriced or under-priced. These are areas where smart money will get involved in order to capitalize on the pricing imbalances.
Best 5 minute scalping strategy based on stochastic, MACD, Bollinger bands
Although here, we used two default indicators for 5 minute opening range breakout scanner. One is 20 EMA, and another is a volume indicator. But many Traders like to use some other indicators like stochastic, MACD, or Bollinger bands. So I am now sharing some best settings of these default indicators. Apply these settings to get output.
Best indicator settings for 5 minute opening range breakout
Default indicator settings work best. Other factors that can influence indicator effectiveness are: market conditions, Fundamental releases(news, financial reports) e.t.c, the best advice would be to use settings that you are experienced with, keeping in mind that default settings work just as good, but the important thing is your interpretation of price movement.
The best macd settings for 5 minute chart will be 12,26,9. If you feel more comfortable with stochastic indicator and replace it with MACD, then the best stochastic settings for 5 minute chart will be %k period 6, %d period 3, slowing 4. The levels will be 20 and 80. last but not least, if you find the Bollinger band more useful than stochastic or MACD, then use Bollinger bands. And Bollinger band settings for 5 minute chart will be period 18, shift 0, deviation 3.
5 minute scalping strategy pdf
Many traders want to study more handy ways. Like they feel comfortable getting a pdf file with any type of strategy. So I made a pdf file on 5 minute opening range breakout strategy. Just download it from here and keep it on your personal computer. Then when you get time, study them.
Conclusion
We can see a relationship between lower time frames and higher time frames. Most lower time frame strategies are good for retail traders who like scalping. Trade entries which are taken on higher time frames are good for analyzing price trends and projecting long-term trends, so it is advised to always analyze on higher time frames and execute and manage trades on lower time frames. If 15 minutes or 1 hour chart show you uptrend and you find a buy set up in 5 minute opening range breakout system then that will the best piece of cake on the table!
FAQs
1.What is the opening range breakout?
The opening range breakout is a momentum-based burst in price, past the opening range of the day. Successful traders eye on a 5-minute chart to catch the opening range breakout. They also add volume and 20 EMA indicators for false breakout filtering.
2.How can I improve my opening range breakout?
You can improve it by using multiple confluences of indicators. The best combination would be 20 EMA and volume indicators. parkingpips described how to improve range breakout trading through practicing. If you follow the process, then within three months, you will master the 5-minute opening range breakout system.
3.How do you trade a 5 minute Orb?
Look for a gap in price prior to the day’s 5 minute opening candle. There’s a gap; identify the opening high and opening low range, look for a 20 ema crossover, then check for confluence and rising momentum on the volumes indicator.
