
There are two types of moving averages. Simple moving average and Exponential moving average. The ema, also known as the Exponential moving average, is one of the popular indicators technical traders use. The great thing about EMAs is the flexibility you can use them, from identifying changes in price trends to setting trade orders using them as guides. However, the most common use is for identifying trends because EMAs show an estimated average price depending on the length of the ema. Forex traders use different types of EMAs, but the most popular are 9 ema and 20 ema
Exponential moving average formula
Exponential Moving Averages offer a stronger weighted indication of price movement. For this reason, it has become a trademark technical indicator. Retail traders and big institutions use EMAs, more specifically 9 ema and 20 ema, because of their ability to accurately depict trends. Moreover, as I said in the above passages, its flexibility offers a broad perspective on the technical trading system.
The big lengthened Emas stipulates areas where recent price might return in the future because price behavior hasn’t really changed, and one thing for sure is that price always makes its way towards and away from the EMAs. So it is up to us to learn how and why price moves the way it does, and I can say from the research I’ve done that there isn’t a particular reason.
9 ema and 20 ema under the picture of different time frame
Getting back to the 9 and 20 ema, you will recognize that when you view emas using high time frames like the 1 hour and 4 hour time frames, there isn’t much of a difference in terms of how close they are to price. Still, another thing is that higher time frames hold more weight in terms of the price change. Because higher time frame price moves are made up of the changes in price on the lower time frames, so you can’t necessarily take one’s importance away from the other, but instead, you have to use the lower time frame to see price action and higher time frame to see trend direction.
Development of trade opportunities
When you research and develop trades, you have to first find the trend direction. Once you identify trend direction, you look for areas where the price might be correct. Price points that have been corrected before are known as either support or resistance level. These places are important because there are always volumes of accumulated contracts around those price points, which is why price tend to reject and correct from there. Because there is huge demand or supply, the price has to be correct so that the accumulated contracts can fill.
What is the 9 ema and 20 ema trading strategy?
The 9 ema and 20 ema forex trading strategy is based on the crossover of the emas mentioned above. The premise is that when the 9 ema crosses above the 20 ema, then the price is in an uptrend and if opposite, or when the 9 ema crosses below the 20 ema, then the price is in an uptrend.
The moving average crossover strategy works great for multiple trading styles and can also be used on multiple time frames because of the flexibility of moving averages. For example, scalpers may use the 5 minute or 15 minute time frame to take trades using this strategy. At the same time, intraday traders may focus mostly on the 15 minutes and 1 hour chart. Finally, position and Swing traders will prefer higher time frames such as the 4 hours or the daily chart because that fits their trading style.
Even though these traders may view the charts using different time frames, one thing that will stay constant is that the analysis and the signals will be the same.
Advantages and disadvantages of 9 ema and 20 ema strategy
| Advantages of ema crossover | Disadvantages of ema crossover |
| Weighted and gives accurate illustrations of current changes in price. | More sensitive to fake-outs. |
| Momentum is easily identifiable. | Sometimes EMA turns into a lagging indicator . Lagging prices may fire exit signals late, leading to a draw down of profits. |
| Great for 15 min and hourly charts. | May give late signals on higher time frames when the price has already moved. |
Typical sell setup
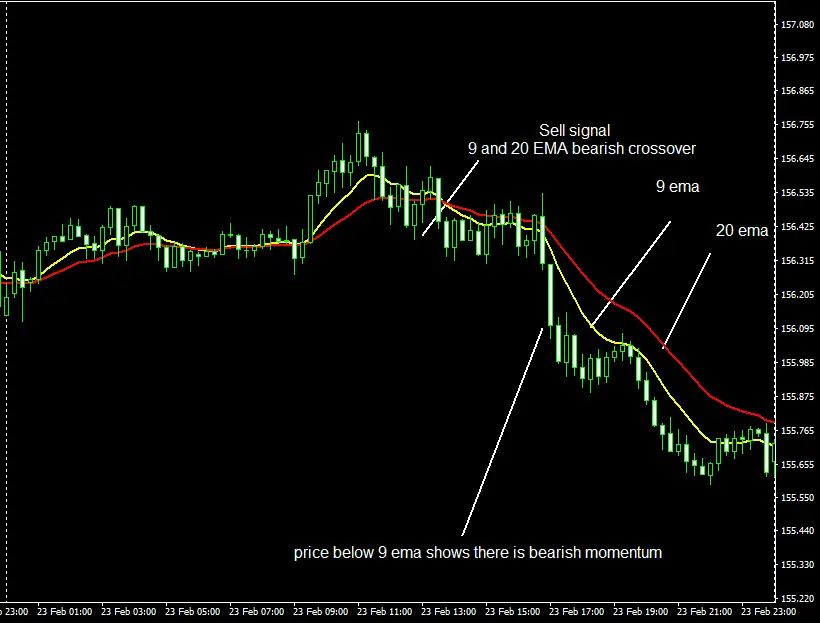
The image above illustrates a typical sell trading signal of 9 ema and 20 ema strategy. You can also use other confluences, such as price action patterns, to confirm if the setup is good or not. When the 9 ema crosses below the 20 ema, and a candle closes below both EMAs, open a sell trade.
Buy setup on 9 ema and 20 ema crossover
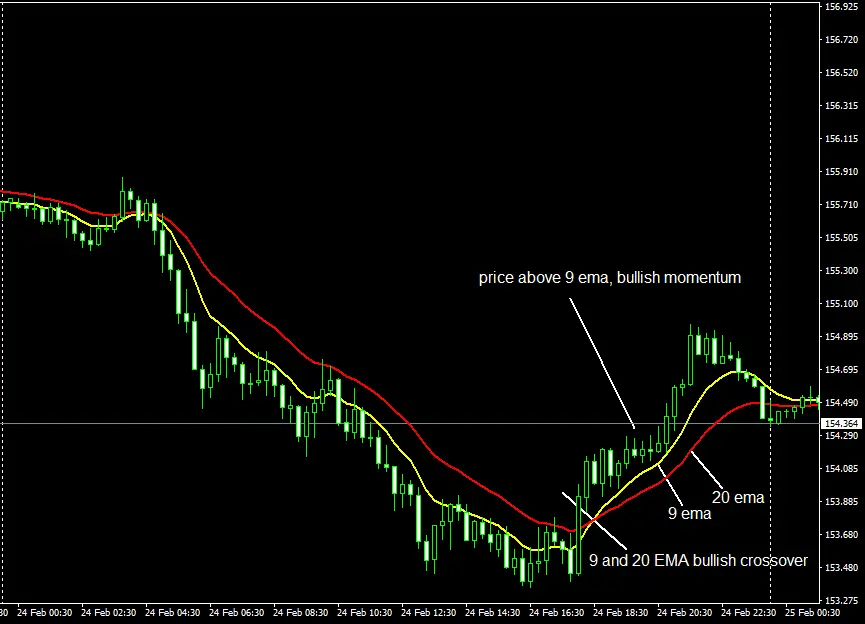
The image above illustrates a typical Buy setup. The course of action from when the 9 ema crosses above the 20 ema and a candle close above both the emas will be to open a buy trade.
Targets and stop loss placement
Your trading style will determine your profit target and stop-loss placement. For example, if you are a scalp trader, your risk/reward would be 1:1, so your stop loss would be the same as your take profit. On the other hand, if you are risking 20 pips, then your take profit would be 20 pips. If you are an intraday trader and love day trade then your risk/reward ratio would be 1:2, so if your profit target is 50 pips, then your stop loss should be placed 25 pips from the entry point. Position and swing traders may use a risk-reward ratio of 1:4 or more as their trades along with the term, so they will have high stop losses and take profits depending on their technical analysis of the trade. Long term traders usually catch big moves.
Other exponential moving averages and how to use them
Exponential moving averages are lagging in nature, so they follow price and not the other way around. Still, with expertise and experience, traders can learn to use emas to telegraph future price movements.
The best ema for 1 hour chart from my experience is the 50 ema, the 50 ema on the hourly chart is technically the 200 ema on the 15 minutes chart, most professional traders use the 200 ema on the 15 min chart because it acts as equilibrium and price tends to return to it when making corrections. This behavior can also be analyzed on the 1-hour chart using the 50 ema.
The best emas for scalp traders would be the 5 and 10 emas because they are short period emas, and they can be used to take minor trends that happen on the 5 minute live chart.
ema 10 vs ema 20
Usually, scalpers use 10 ema, and day traders use 20 ema. 10 ema is best for catching short term moves, while 20 ema is best for catching mid-term moves. More specifically, if you place 10 ema on a 15 minutes chart, that means you are getting 10 numbers – 15 minutes candle’s data. If you put 20 ema on 15 minutes chart, that means you are getting 20 numbers – 15 minutes of candle’s data.
5 ema 10 ema strategy
The strategy that I have described above can also be used on 5 ema and 10 ema for scalping. As scalpers enter and exit trades very quickly and want to get only a few pips like 10/15 pips to use the 5 ema and 10 ema crossover strategy. Where I use 9 ema, you will put 5 ema, and where I put 20 ema, you will put 10 ema. That’s it very simple.
Conclusion
Ema, like other indicators, can be an excellent asset for traders who know how they work. However, they can also be a liability if they are not used with caution or other confluence as they follow price and don’t necessarily predict future price movement. That’s why many experienced traders like akil stokes suggests to use 9 ema and 20 ema strategy with any confluences like relative strength index.
FAQs
Q. What is the 9 ema?
A. The 9 ema is an exponential moving average that gives a weighted average price of the past 9 periods or candles.
Q. What is the 20 EMA?
A. The 20 ema is an exponential moving average that gives a weighted average price of the past 20 periods or candles.
Q. How do you use a 20 EMA indicator?
A. The 20 EMA would be used as an entry signal when the 9 EMA crosses above the 20 EMA, that is, a buy entry signal, and when the 9 ema crosses below the 20 ema, that is a Sell entry signal.
