
Are you looking for the answers to these questions regarding forex chart patterns ?
- What is forex chart patterns and how to draw them correctly?
- How to enter the trade in a rising trend ?
- How to enter a trade in a falling trend?
- How to know when to close the trade with massive profit?
- How to know when to close the trade with a small loss, if forex market conditions don’t favor you?
- How to draw forex chart patterns professionally and adequately to get clear entry signals like big banks and hedge funds?
If you are searching for the solutions to these questions, then this article will help you immensely as this article is all about common chart patterns. Forex Chart pattern is a mighty weapon because you will be able to mark the price charts’ central area before the explosions happen on the forex market. I guarantee you if you master the various types of forex chart patterns, then potentially, you will make a lot of money from forex.
Remember, you can identify chart patterns to take advantage of future explosive price swings as each chart pattern can push the price to a new price movements.
Don’t you want to have colossal cash, George Soros? If so, then chart formations will surely help you identify areas and conditions where the forex market is ready for a future breakout. But to detect these areas properly, all you need to do is learn these formations properly what I will describe with examples below.
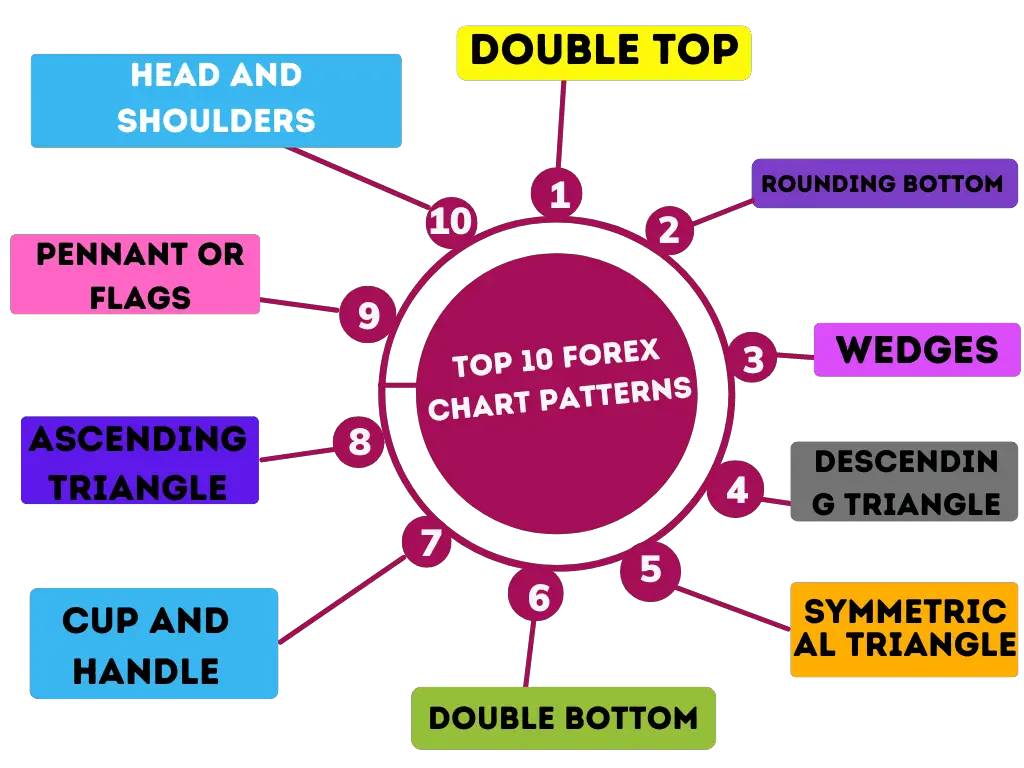
Top 10 forex chart patterns you should master
Head and shoulders, Double top, Double bottom, Rounding bottom, Cup and handle, Wedges, Pennant or flags, Ascending Triangle, Descending Triangle, and Symmetrical Triangle are the most traded and most used chart patterns as a forex trader you should know and master. If you can master these chart patterns, then trading will be easy for you.
There are three types of forex chart patterns
1)Continuation patterns
- Pennants
- Rectangles
- Corrective Wedges
2)Reversal chart patterns
- Double top/ Double bottom
- Head and Shoulder patterns
- Reversal Wedges
- Ascending/Descending Triangles
3)Neutral forex chart patterns
- Symmetrical Triangle
Continuation forex chart patterns
These types of chart patterns appear when the price is trending. If we spot a trend continuation chart patterns during a trend, we can predict that the price is merely correcting. So you can guess that a new move is like to happen in the same direction.
Pennants
Pennants forex chart patterns could be bullish or bearish depending on the trend direction. When forex patterns occur during a trend, there is a possibility that price will move in the direction of the overall trend. The fun part is that the expected move is usually a measured move that means the breakout point’s profit target equals the pennants’ size.
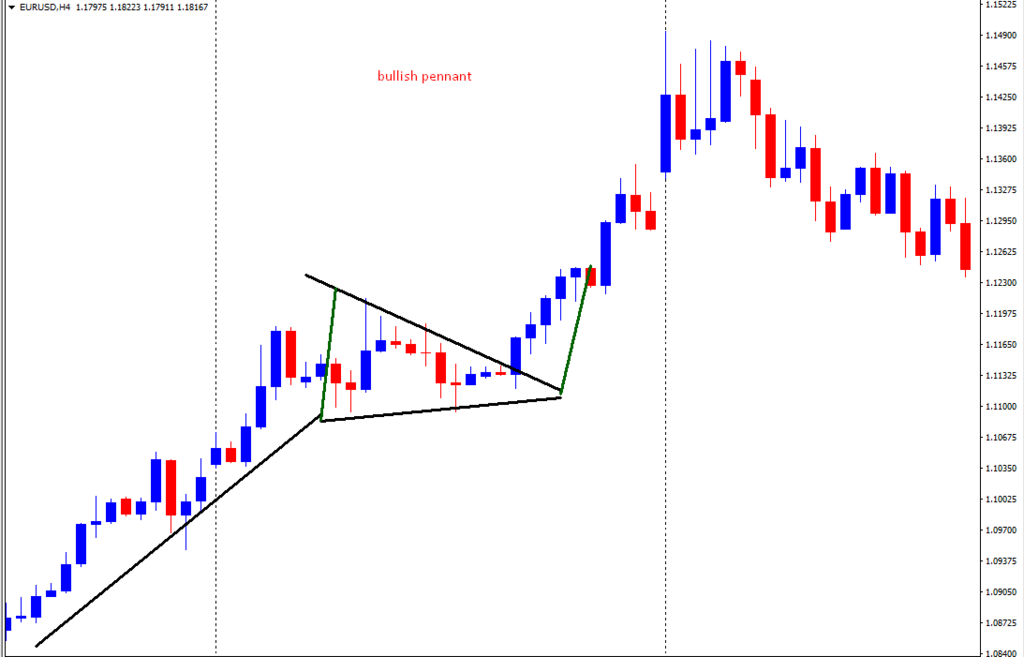
Here look at the green lines of the bullish pennant .these green lines indicate the actual size of the bullish pennant, and you can expect the same price move in the upside. When you open a trade, you should always open a buy position when a bullish candle breaks the pennant’s black line. You can place your stop loss below the black line. Because when price breaks the black line, this bullish pennant is invalid, and there is an excellent chance that your trade may go against you. So try to cut losses early. If your trade goes in profit, then close your trade manually when price finishes the green line as this is the pennant’s actual size. Or you can set you to take profit there.
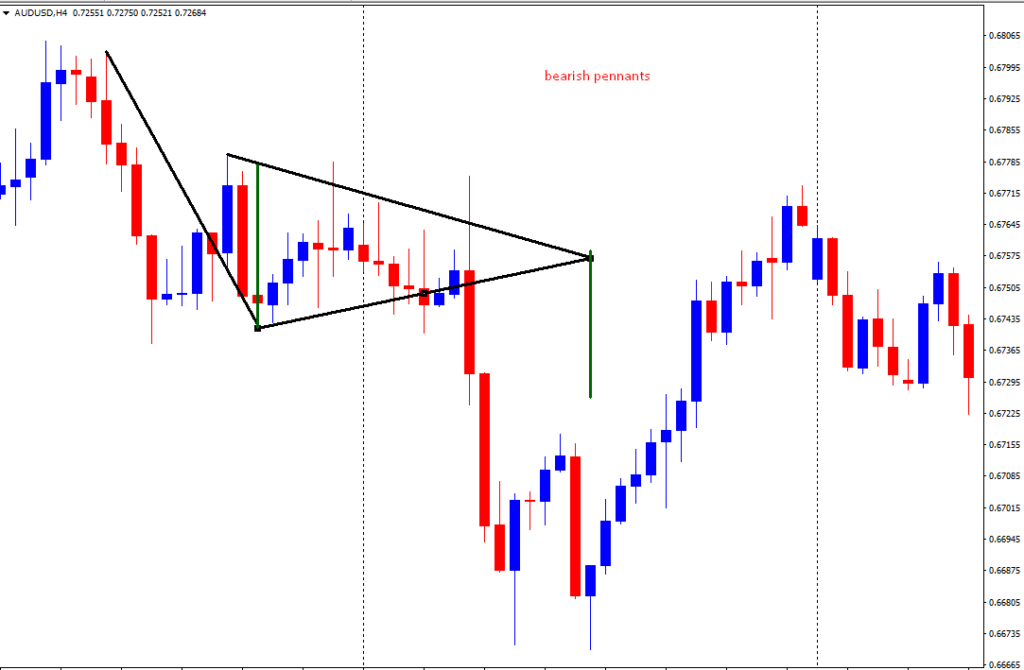
The bearish direction chart pattern is the same as the bullish chart pattern, but the difference is it will indicate the bearish move is coming, so you should open trade on the sell side when a bearish pennant happens in the forex market.
Here, green lines are the pennant’s measurement, so you should target the same measurement as your profit, which means the green lines should be your profit target. Place your stop loss above the black line and open position only when any bearish candle breaks the lower black line.
Rectangle forex chart patterns
Another most profitable chart patterns are bullish rectangles and bearish rectangles chart patterns. This trend continuation patterns or formations represent price consolidation period of time. This consolidation happens within horizontal support and resistance levels. Remember, during a trend when the price starts moving sideways, or price consolidates, you can predict that another trending explosive move will happen when price breaks out the rectangular box. And the size of this move will be as big as the size of the rectangular box.
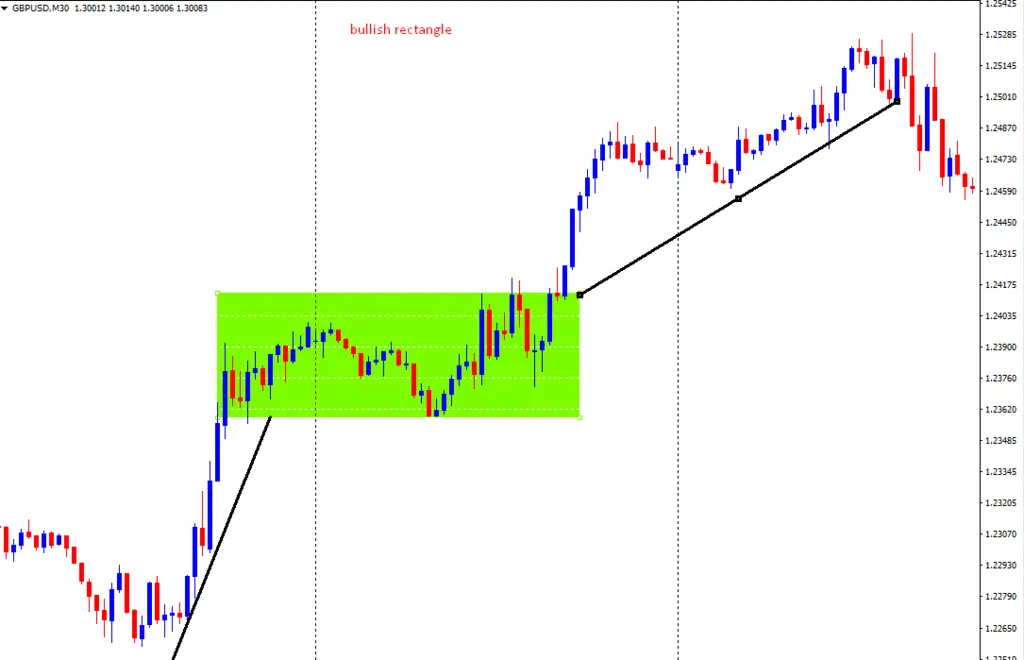
First, take a look at the buying pressure, and then suddenly, price starts to consolidate, and here is an excellent chance for the buyers. Buyers can wait and enter the market again when bull candlesticks patterns eventually breaks the rectangular box here in this illustration, the green box. If you take the trade, then you should place your stop loss below the green box. Take your profit when the price goes as much as the green box, or you can put your take profit there so your trade will be close automatically.
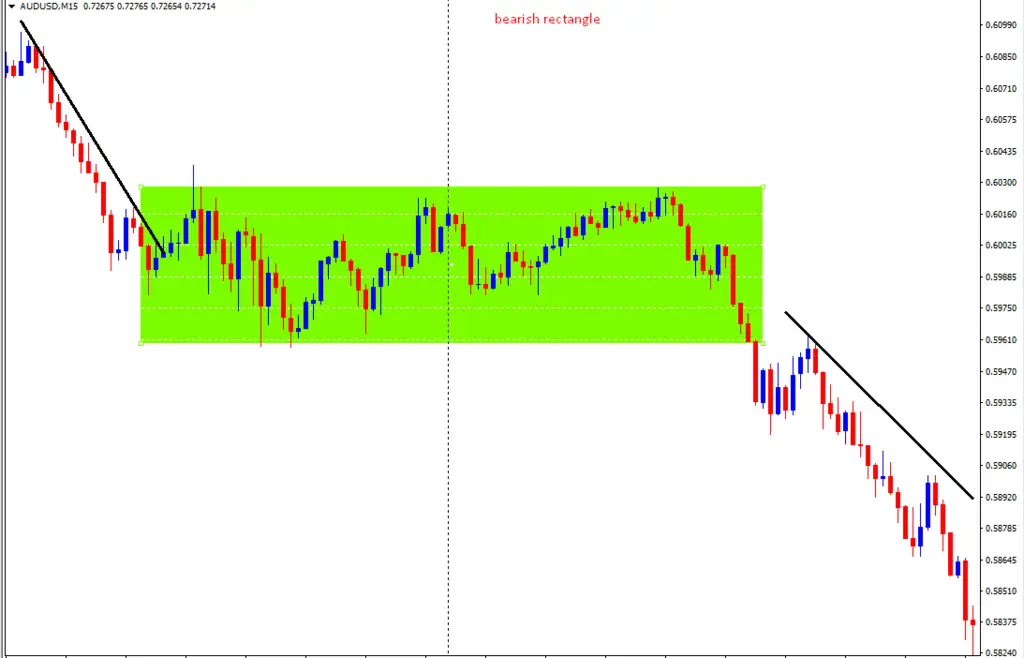
The trading rules will remain the same. Place the stop loss above the green line of the box and take your profit when the price goes towards your direction as much as the total green rectangular box’s size. Rectangular patterns are very popular forex chart patterns
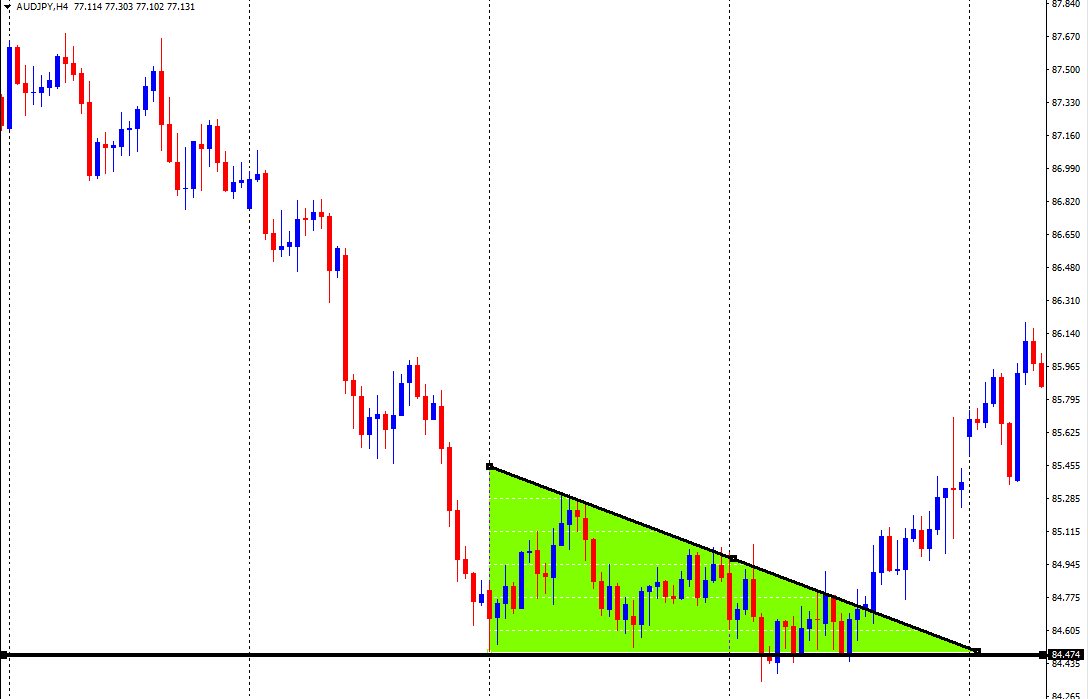
Corrective wedge chart pattern
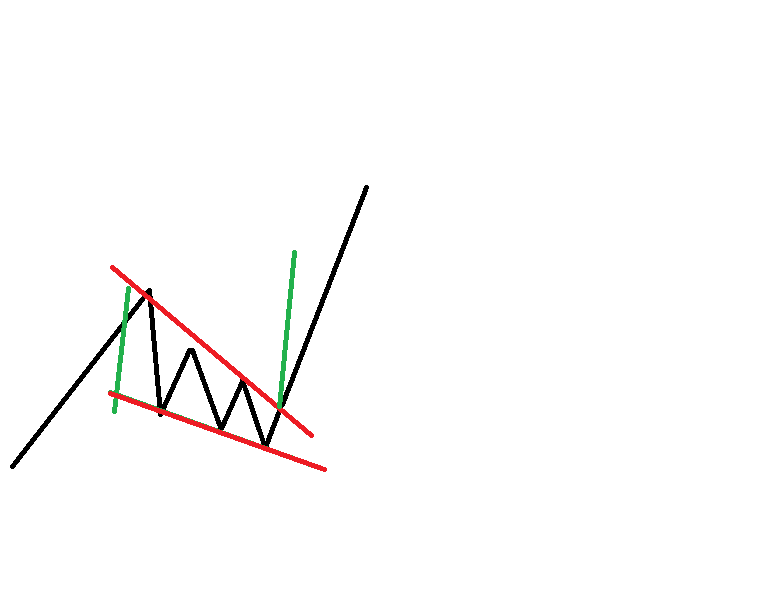
suppose there is a strong trend and you found a corrective wedge then you assume that another strong trend is coming. And the size of the second trending movement will be as big as the wedge chart pattern.
Suppose you are in an uptrend, and you found a falling wedge, then this is a corrective falling wedge, and you can predict that the billish trends will continue after the correction of the price. Place your buy position when price breaks the wedge and set stop loss below the wedge. Take your profit when the price goes towards your direction as big as the size of the wedge.
Similarly, if you are in a downtrend and found a rising wedge, this is a corrective rising wedge; you can predict that the bearish trends will continue again after the price correction.
Place your sell trade when price breaks therising wedge and set stop loss above the wedge. Take your profit when the price goes downside as much as the actual size of the rising wedge.
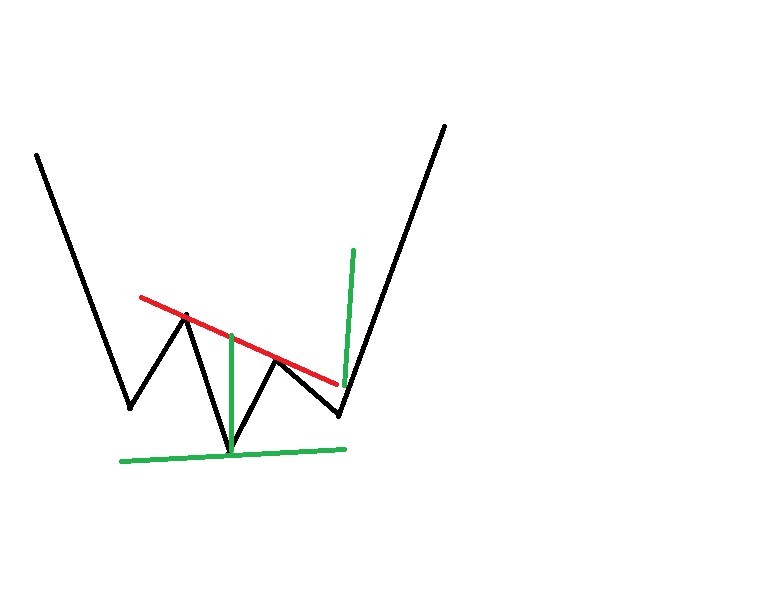
Double top chart pattern
when you see a double top or double bottom chart pattern happens, you can predict that a trend reversal patterns will happen very soon.These reversal signals are very powerful.
The tops are the highest levels or swing highs of price. If there is huge buying pressure and buyers push the price to a certain level that can’t be broken, then this chart pattern formed. when the price hits a certain level that can’t be broken.
When the price hits the previous top-level again, then double top formation appears and hitting the level a second time, the price may bounce off slightly, but then the price will surely return to test the neckline again.
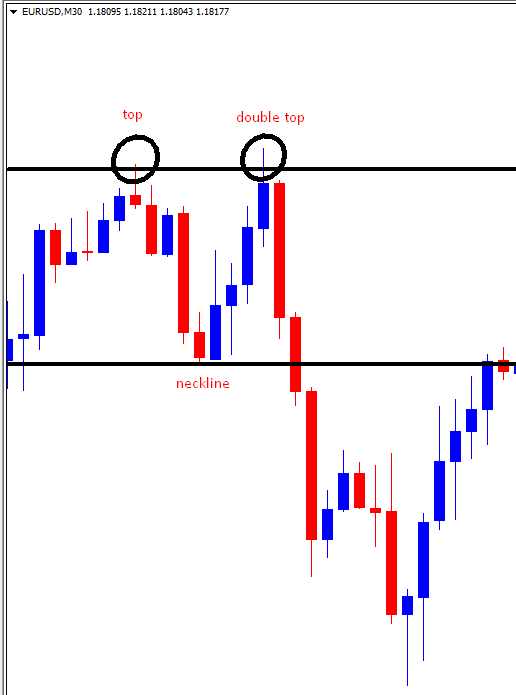
In the chart above, you can see that two tops were formed and look closely at how the second top could not break the high of the first top. When you find such scenarios, you can predict that a reversal will happen in the market. The pressure of buyers is finished. Now the financial markets’ investors wish to open sell positions will come and if they want they can make the market bearish. Double top chart patterns are popular reversal patterns.
How to trade: firstly, only take a trade if you think the reversal of uptrend is coming.
Secondly, as you anticipate there are many sellers who will also come to the forex market right now and make the market bearish so simply put a sell position under the neckline. Look at the pictures I have shown above how price moves nicely to the downside. See how the price breaks the neckline and comes towards your direction. So if you take a sell trade, you can make a massive amount of cash. If you are a day trader, you can pick this strategy as this is the chart pattern of day trading. Also, swing traders and position traders can take advantage of such types of chart patterns. Your stop loss will be above the double top formation, and take profit would be as big as the double top formation.
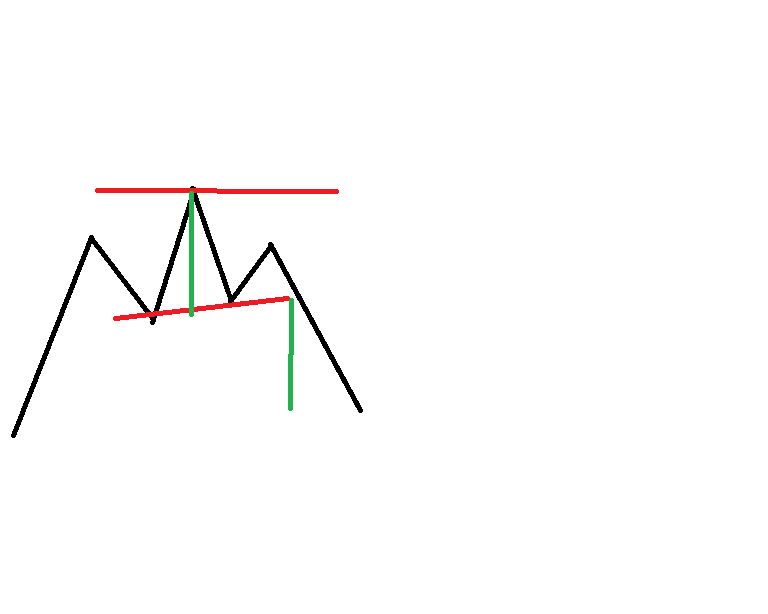
Double bottom chart pattern
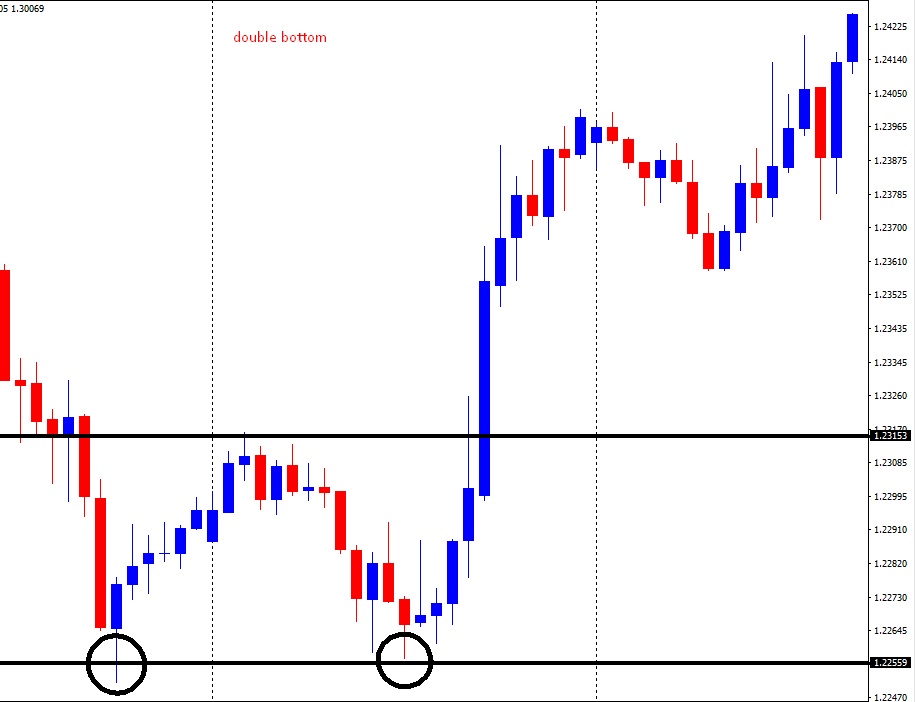
There is much similarity between the double top and Double bottom. This chart pattern is also a trend reversal chart pattern. The only difference is traders need to go long positions when double bottom chart patterns occur.
From the chart above, you can see that the price formed two bottoms or swing lows after the downtrend .As price couldn’t go below a certain level. See carefully how the second bottom wasn’t able to break the first bottom. When this scenario happens, you can predict that the market is seller less, and buyers will take control of the market. And when the price breaks the neckline eventually, the market made a nice move at the upside. One thing that remembers this chart pattern works well only after a strong downtrend. If there is no trend, then don’t enter any trade.
Place a buy set up after the break of the neckline. Put your stop loss below the double bottom line. Your profit target should be as big as the double bottom formation size. If you are looking for the most successful forex chart patterns, then these patterns are for you.These chart patterns are formed at the market reversal points.
Head and shoulder chart pattern
Do you know in currency markets, which chart patterns are the most reliable forex chart patterns in the technical analysis? If you guess head and shoulder & inverse head and shoulder patterns are the ones and which is also used by big boys, then your answer is absolutely correct.
This chart pattern looks like a head with two shoulders, for trading with this pattern. First, you need to find an uptrend, and then the price will be a higher high, which is its head. The price will come back then and will take some rest. After retracing back, the price will then create another top, which is not higher than the first higher high. afterward, the price will drop again. Then the price will make another shelter, which is the third top. Which you found this 3rd top, then this is the head and shoulders pattern. If you want to find the perfect neckline, then just connect the lowest points of the 2 troughs.
You can put a sell order if the price breaks the neckline. Measure from the high point of the head to the neckline. Calculate how much pips are there and take your profit according to that calculations. Here in this example, when price breaks the red line, just put your sell trade, and the green line is the distance of neckline to head so that the lower green line will be your profit target.
Inverse head and shoulder chart patterns
Now it’s the time to discuss reverse head and shoulder. In head and shoulder, we look for a downtrend but here for getting a perfect inverse head and shoulder firstly we have to search for a downtrend in the chart. And here, the price will create the bottoms, not the tops. With this formation, you need to place a buy tread above the neckline. Remember, we only place our long setup when the price breaks the neckline. For fixing your target just range the area between the head and the neckline. here in this picture; the vertical green line will be your target. Place your stop loss below the shoulders.
Some trade management advanced systems by following which you can hold the trades and scale your profit. I will discuss these advanced trade management method in my other article. These forex chart patterns strategy & technical analysis is used by many big boys to make an enormous profit .so if you follow the instructions I stated above, you will also be able to trade like hedge funds.
Ascending triangle chart pattern
The ascending triangle is very similar to the rising wedges. The only difference is rising wedge has the higher tops while the ascending triangle has horizontal tops. For getting an ascending triangle firstly you need to find resistance level and secondly higher lows. Look at the chart above. In this case, the buyers try to gain strength as they are making higher lows. They keep pushing the resistance level.so the outcome is obvious you can boldly predict that a strong breakout is coming. But the problem price action traders face is in which direction will it break? Will the buyers break the resistance level? or will the sellers come and break the ascending triangle and take control of the market.?
There are a lot of forex charts patterns pdf books in the forex market. These pdf books will suggest that the buyers will push the price up and the breakout will happen in the upside. They will give you the wrong message that price will break out past the resistance. but the reality is Sometimes the resistance level is too strong that there is not enough power to break the resistance level. In the chart see how miserably the buyers lost power. Then sellers take the control of the market You can notice that the drop’s distance was more than the triangle formation height if you look closely.
Put a sell order when price breaks the ascending triangle. Place your take profit after measuring the area of the triangle. Set your stop loss above the resistance level of the triangle.
Descending triangle chart pattern
The descending triangle is very similar to falling wedges. The only difference is the falling wedges have lower bottoms while the descending triangle has horizontal resistance bottoms.
The trading method of the descending triangle is the same as the ascending triangle. Just put buy order when the price breaks the triangle and place stop loss below the horizontal support level. Book your profit when the trade is in profit as much as the size of the triangle.
Many traders search for forex chart pattern recognition software to find out the perfect patterns. But after reading this article, I think you will not do the same as it is not possible to find out these types of patterns through software. The only human brain can find out these types of critical patterns.
Symmetrical triangle
These types of common chart patterns have two sides. The size of the two sides will be approximately the same. Which creates the neutral character of the formation. When such forex patterns occur on the chart, we may predict that the price movement will be equal to the formation’s size. Although the breakout direction is unknown due to the two sides of the triangle’s equivalency, smart professional trader waits for the breakout to happen.He waits for good trading opportunity. If you are not a chart pattern trader, then find out set up with an asymmetrical triangle is not a challenging task for you. If you trade a symmetrical triangle, you should stop loss right beyond the breakout’s opposite direction. If your trade goes to profit, close it when the movement is as significant as forming the triangle.
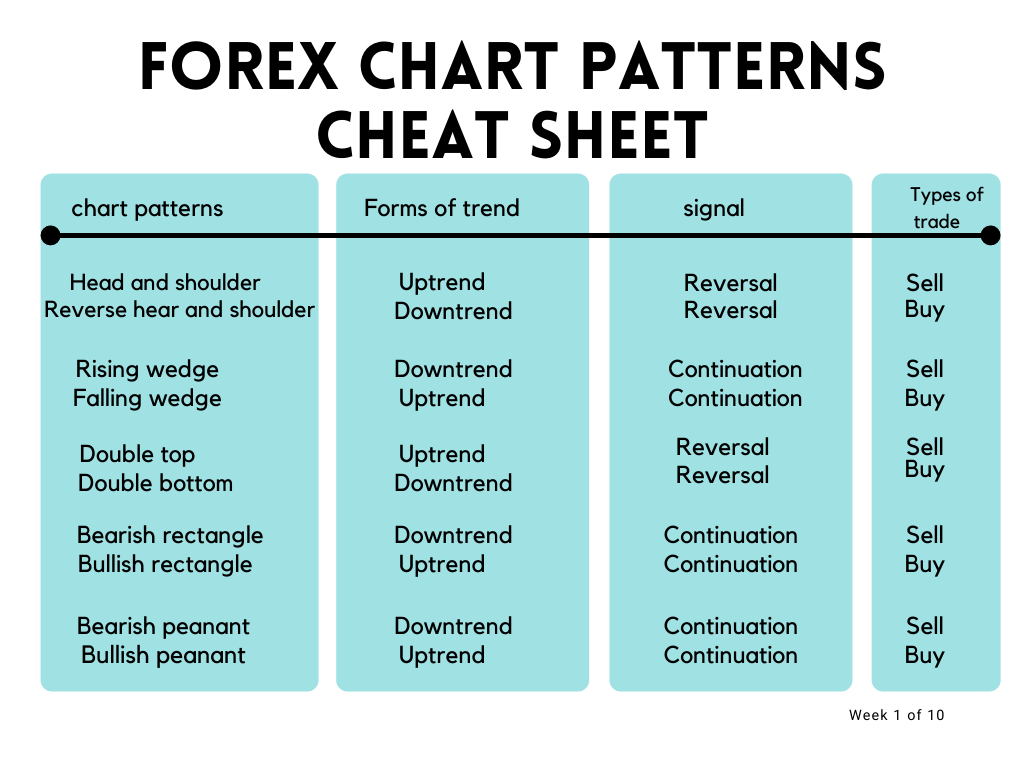
Forex chart patterns cheat sheet
If I tell you, I will give a forex chart patterns cheat sheet to understand all the patterns more clearly. You can take it as your trading signal also. In this cheat sheet, I will tell you the direction of the trend and the market’s upcoming explosive price movements. Voila?! Yes! I will give everything I keep reading.
I know detecting forex chart patterns and using them correctly is hard. But if you follow the instructions I stated above; then the chance is higher that you will be successful in forex trading. So don’t waste your time searching for forex chart patterns technical indicators; instead, practice these patterns and make your trading life easy.
Final Talk
You can trade these common forex chart patterns at any timeframes but if you are new at forex then stick to only longer timeframes like 4 hour or daily chart. If you can combine any price action simple methods with chart patterns then your trading will be more advanced. But before experimenting with these basic methods first grow your trading knowledge.After achieving knowledge open a demo account with any popular broker trade yourself!
Professional trader’s opinion about forex chart patterns
” While there are several chart patterns of varying complexity. There are two patterns, the Head and Shoulders, and the Triangle occurs regularly”
CORY MITCHELL
” The double top and double bottom patterns are powerful technical tools used by traders in major financial markets including forex.”
Warren Venketas
” Chart patterns are the basis of technical analysis”
Callum Cliffe

many many thanks mate