
Fibonacci retracement levels are nothing but some horizontal lines. These horizontal lines indicate the market’s support and resistance levels. Traders use these support and resistance levels to identify core points of the markets and make decisions according to them.
I am giving you a practical example to clarify the facts. For example, If the USDCAD pair rises from 1.2456 to 1.2879. Then the price of USDCAD drops to 1.2717. It means the price retraced 38.2%. Is it clear now? If not, don’t worry; I will dig deep into this exclusive content and thus make you clear the entire matter.
Important Fibonacci Retracement Levels
The most important Fibonacci retrancement levels are 23.6%, 38.2%, 50%, 61.8%, 78.6%. Although many scholars and technical analysts don’t recognize the 50% level as the official Fibonacci retracement level.
Traders connect two important market levels through Fibonacci tools. One point is high, and the other is a low point. When you connect these high and low points, the tools automatically draw some levels, which are the Fibo levels. Such as 23.8%, 38.2% levels.
Who invented fibonacci retrace
Fibonacci retracement levels originated in ancient India between 450 and 200 BCE. Leonardo Pisano Bigollo, an Italian mathematician, also known as Leonardo Fibonacci, learned about Fibonacci numbers from the Indian merchants. Then Leonardo Fibonacci taught these numbers to western Europe. And as he is the first and foremost person who valued these numbers and taught them to people, when they became popular worldwide, people call it after his name Fibonacci sequences.
Who is Acarya Virahanka, and what is the relationship between him and these levels?
We already know that Leonardo Fibonacci did not invent Fibonacci levels. Instead, he is just a lucky guy who first learned about it and then taught it to Europe. Then who first invented it in ancient India? There must be someone behind the idea of these sequences. Yes, The man behind these levels and numbers is Acarya Virahanka. Around 600 AD Acarya Virahanka first developed the idea and method of Fibonacci levels.
Gopala, Hemacandra, and Narayana Pandita also contributed to the Fibonacci sequence development.
Gopala, Hemacandra, and Narayana Pandita are the next generations of Acarya Virahanka. These mathematicians also contributed to developing the idea that their ancestors Acarya Virahanka founded. So when we recall the founder name of Fibonacci levels, we should not only recall Leonardo Pisano Bigollo’s name but also utter Acarya Virahanka, Gopala, Hemacandra, and Narayana Pandita’s names. Last but not least, it is crystal clear that Fibonacci sequences were first developed by ancient India but not by Europe.
Fibonacci retracement calculator and calculating process
Fibonacci numbers are based on the golden ratio. To calculate this golden ratio, you first need to start a sequence of numbers from zero to one. Second, add the prior two numbers. Continue the same process as this.
0, 1, 1, 2, 3, 5, 8, 13, 21, 34, 55, 89, 144, 233, 377……….
And the fibonacci retracements levels like 23.6%, 38.2%, 50%, 61.8%, 78.6% all are derived from this number sequences.
If you divide a number by the next number, you will get the result of 0.618 or 61.8%. And if you divide a number by the second number of its right, you will get the result 0.382 or 38.2%. This way, all the ratios are generated. The only exception is 50%. For this reason, professional traders don’t recognize 50% as the official Fibonacci number.
You don’t need to confuse yourself reading all these mathematical terms and functions. You won’t need to calculate these numbers and all the things manually. There are dozens of calculators which will make your task easy. Just click here, and you will get a Fibonacci calculator.
But personally, I will not suggest you calculate these numbers even with a calculator because you have Fibonacci retracements tools built-in in your mt4 and mt5 terminal. Then why will you search for any manual option?
Just look at how beautifully you can draw Fibonacci retracements levels through your built-in tools. So why run after manual calculators and mathematics? After all, your target is to become a successful forex trader but not become a professor or mathematician!
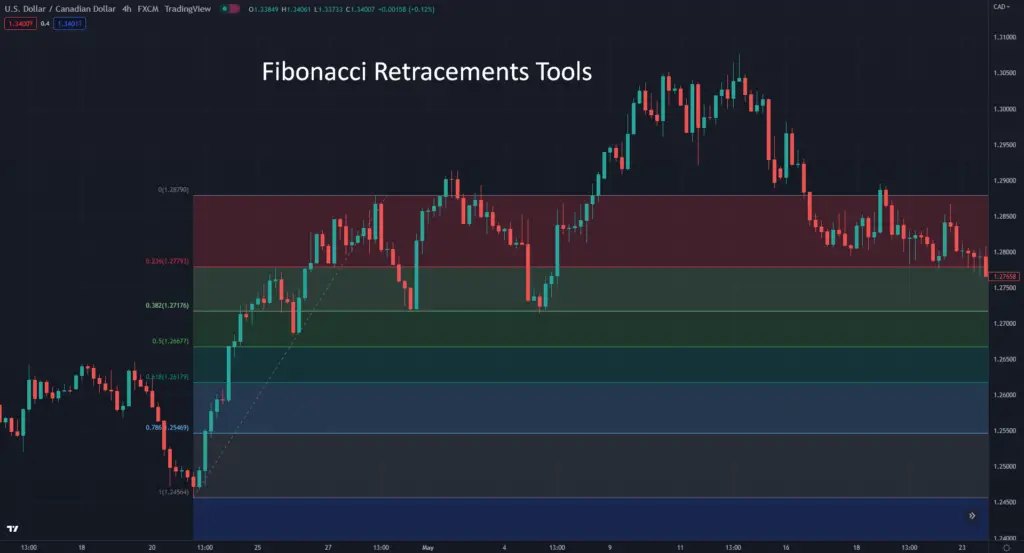
How to place fibonacci retracement
You need to detect the market’s high and low points of any particular timeframe. For, say, in the USDCAD pair, you select a 4-hour timeframe. Here your high point is 1.2879, and your low point is 1.2456. Now you need to draw low to high or 1 to 0. 1 will be your low point, and 0 will be your high point, just like this picture.
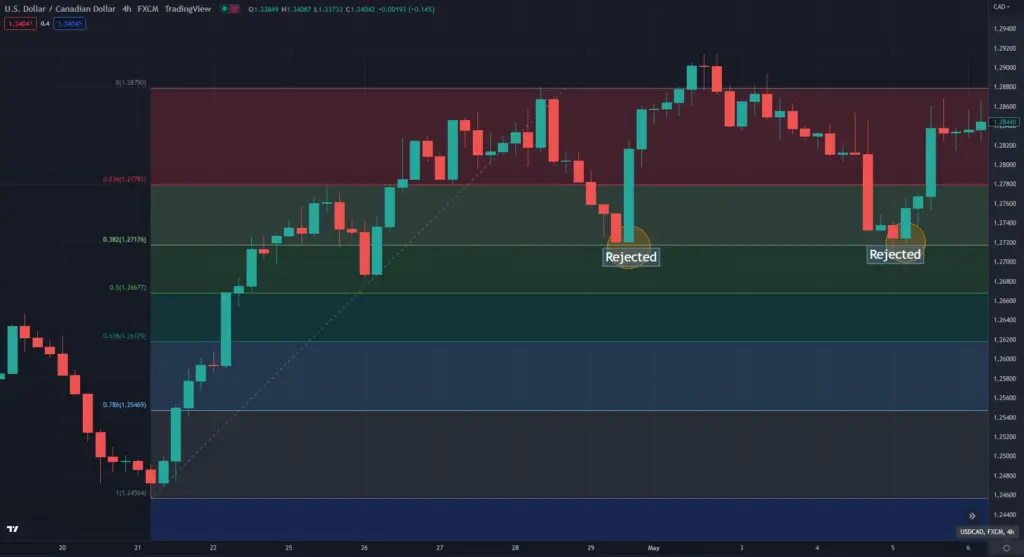
See how Fibonacci retracements level works. Every time the price gets back to the 38.2% level price is rejected back. So if you have proper knowledge about these retracements levels, you will be able to take buy trades from these levels. But remember, your chances of success lie in how perfectly you place Fibonacci retracements levels. First, learn if you don’t know how to use the Fibonacci retracement tool. Otherwise, you will draw it wrongly and make a huge loss in trading!
how to use fibonacci retracements in real trading-Learn with live EURUSD trade
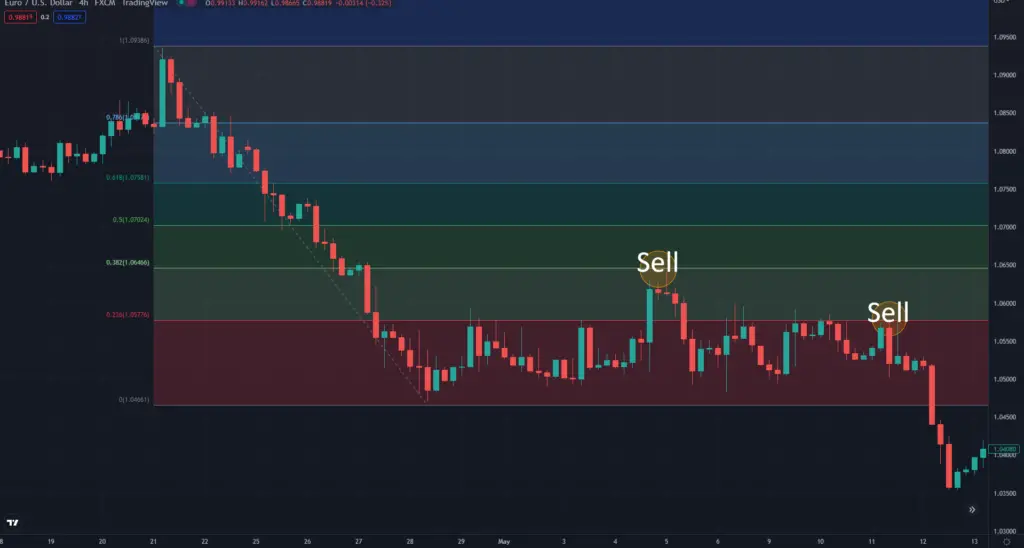
Here in eurusd trade, price falls sharply. Then you detect the market’s high point of 1.0938 and low point of 1.0466. You draw Fibonacci retracements tools perfectly and wait. Then when you find any rejection from the retracements level, prepare to sell from there. Here price gets rejected from the 38.2% level first. You can open your first sell trade from here. Then you get rejected from the 23.6% level for the second time. Sell again from this point.
Just imagine if you sold both times, then your profit will be huge, and your account will also increase. But to catch these sniper trades, you must know how to properly use Fibonacci retracements levels.
Final Talk
In this context, I tried to explain everything from what is fibonacci retracement to how to set up Fibonacci retracement. If any enthusiast trader read out the whole content attentively and applies the method in day-to-day trading, he or she could make a decent profit. But remember that fibo levels’ success lies in how perfectly you draw the levels. So first, learn the crucial market zones, where to put your low point, and where to put your high point.