
Newbies and many intermediate-level traders think that stochastic rsi and rsi are similar or both are the same indicators, but the reality is totally different. RSI is a derivative of price, whereas stochastic rsi’s formula is generated from RSI values. StochRSI is used to measure the strength and weakness of the relative strength index (RSI). As there is a huge controversy between them so, today, I will disclose some basic differences between Stochastic Rsi vs Rsi.
StochRSI moves sharply and randomly from overbought to oversold or oversold to overbought. But you find rsi moves slowly.
Stochastic rsi Details
Tushar Chande and Stanley Kroll first developed the idea of Stochastic rsi in their book ” The New Technical Trader.” Traditional and defaults indicators indicate 70 and 30 as overbought and oversold levels, but StochRSI uses 80 and 20 as overbought and oversold levels.
By using StochRsi, you can identify not only the overbought /oversold zone but also whether the currency pair is trending or not. Like if you find StochRSI is above 50, you can conclude that a short-term buy trend is near. Similarly, if you find StochRSI is below 50, assume that the short-term sell trend is about to happen.
Stochastic Rsi vs Rsi
Most of the time, we find the question between stochastic Rsi vs Rsi, which one is best? Although relative strength index (RSI) and StochRSI are gained from the same reversion theory, RSI produces its values from price, whereas StochRSI derives its values from RSI. Stochastic RSI provides a stochastic calculation of RSI. StochRSI works on the assumption that in an uptrend, prices lean to get closer to their highs. In contrast, The RSI assumes that prices show a natural habit of adjacent far from the average value before retracting.
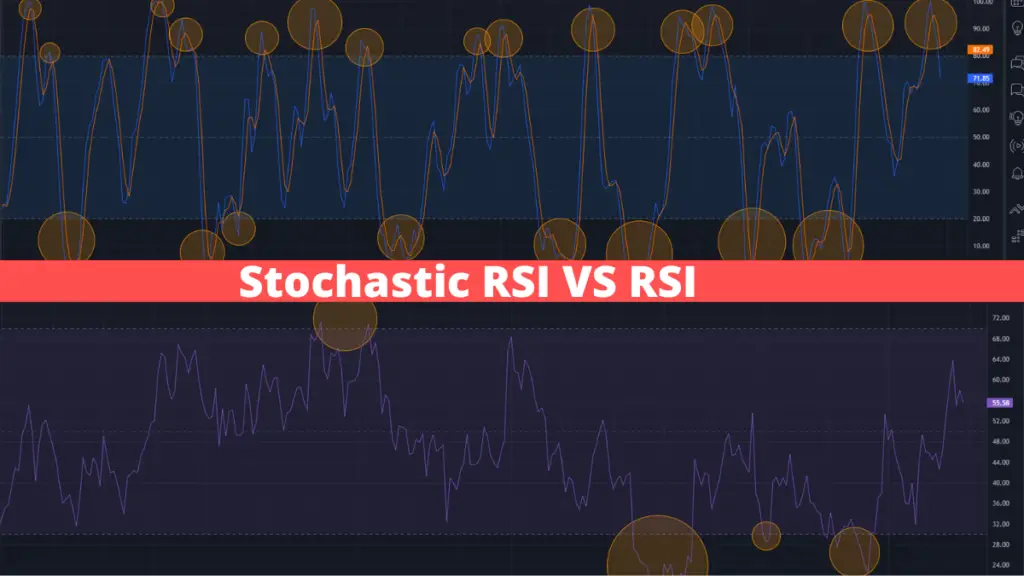
One of the major differences between both of them is how fast and slow they move. StochRSI moves too fast from overbought/oversold zones, but RSI moves less rapidly. Look at the picture above. The first one is for stochastic Rsi, and the second one is RSI. Observe closely in StochRSI how many times the value goes in the overbought and oversold zone, but on the contrary, in the RSI indicator, values go in the overbought and oversold zone only a couple of times.
Although you find different results from these two technical analysis tools, their main aims are to show forex traders the oversold or overbought zones.
StochRSI formula
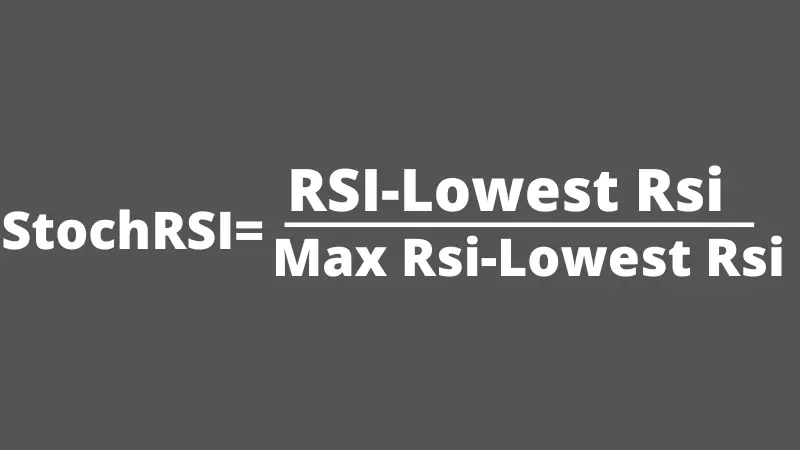
Where, RSI= Current RSI reading
Lowest RSI=Lowest RSI reading over the last 14 periods
Highest RSI=Highest RSI reading over the last 14 periods.
Stochastic RSI calculation
First, you need to calculate the Rsi for a specific period of the data series. As traders always use rsi 14 and the default settings are also 14, you will take 14 periods. Then subtract the minimum RSI value for the 14 periods from the recent rsi value. Next, subtract the minimum value for the 14 periods from the highest RSI value. Apply this calculation if you want to get the result from the stochastic Rsi.
But don’t worry; you won’t need to go through such complicated calculations or formulas. As we have a ready-made built-in stochastic rsi indicator, our work will be easy. Just open the StochRSI indicator and see the result.
Stochastic RSI trading strategy
Tushar Chande and Stanley Kroll, Developers of stochastic RSI, suggest that forex traders should go long when the value falls below 20 or an oversold level. And Traders should open short positions when the value exceeds 80 levels or overbought zones. They also added that when the value remains near or at the 50 levels, the market is now in a sideways mood, so it is not wise to open an position at that time.
But as a market analyst, I applied the formula in stochastic Rsi but got some fake signals also. That’s why I add a filtering method to this strategy. And that is counting my support and resistance zones. The method is simple. When you find StochRSI is in the oversold zone, just check whether the price is in the support area or not. Take the trade if the price is also in the support area. But if the price is in no man’s land, then avoid the trade. That’s a false signal.
Vice versa, rules will be applied for a sell trade. If you find the Stochastic Rsi indicator is in the overbought zone, check whether the price is in the resistance zone. If the price is also in the resistance zone, then simply take the trade. But if the price is not in the resistance zone, that is a false signal.
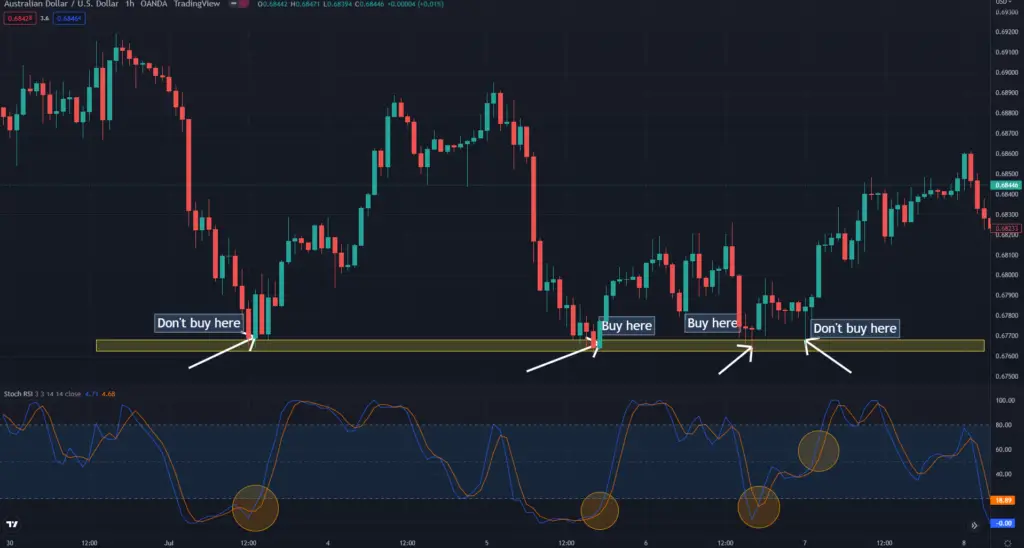
Here you find a couple some signals from the Stochastic RSI indicator, but you will not take every trade. In the first trade, you found that although RSI is in the oversold zone, you will not take the trade as your price didn’t find any previous support level. The second signal is valid as the RSI indicator is in the oversold zone, and the price is also at a support level. So you will take the trade. Price didn’t go much further, but you get another signal for the third time. You find that price is in the support level and the indicator is in the support zone. Just take the trade. Although you get another trade for the last time, where the price is at a support level, the RSI indicator didn’t give you a buy signal, so you will not take the trade.
If you filter the trades in such a way, you can avoid too many fake trades. Here I show you practically How many false signals you can avoid just by adding the support levels.
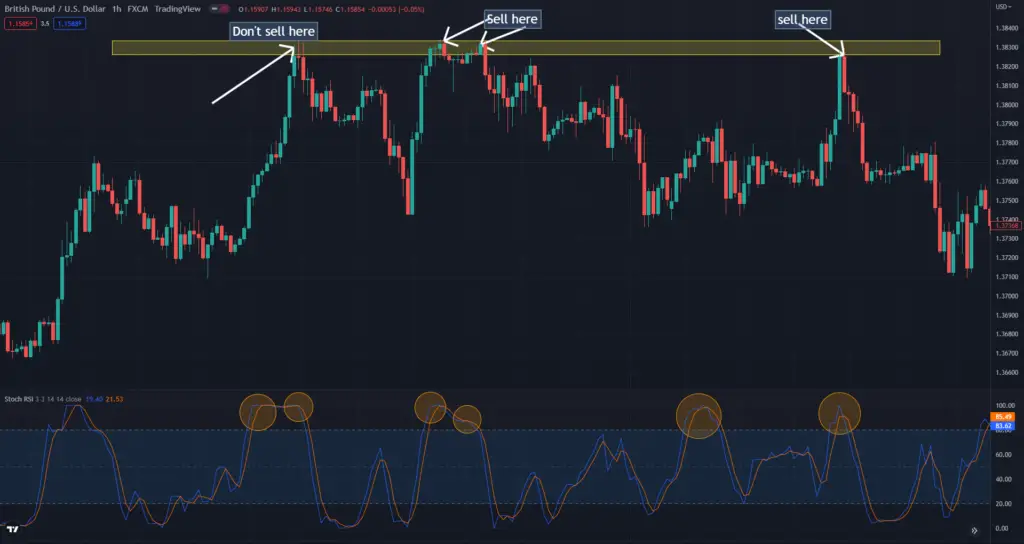
Here you find four signals from the Stochastic RSI indicator, but you will not take every trade. Although RSI is in the overbought zone in the first trade, you will not take the trade as the price didn’t find any previous resistance level. The second signal is valid as the RSI indicator is in the overbought zone, and the price is also in the resistance level. So you will take the trade. Price didn’t go much further, but you get another signal for the third time. The price is at a resistance level, and the indicator is in the overbought zone. Just take the trade. Then for the fourth time, you find Rsi is in the overbought zone, and the price is at the resistance level again. Take the trade and enjoy the green pips!
If you filter the trades in such a way, you will be able to avoid too many fake trades. Here I show you practically How many false signals you can avoid just by adding the resistance levels.
FAQs
1. Which one is better RSI or stochastic RSI?
If you are a conservative trader, use RSI; if you are an aggressive trader, go for stochastic RSI. But remember, both could be powerful only if you filter your system just by adding support and resistance levels.
2. Is stochastic RSI same as stochastic?
No, stochastic RSI is different from the stochastic indicator. You will find stochastic by default with the mt4 or mt5 platform, but for getting stochastic RSI, you need to take the help of charting platforms like Tradingview.
3. Is stochastic RSI good?
Yes. Stochastic RSI is a good indicator. And If you add a filtering process like support and resistance levels with stochastic RSI, then it could be a super powerful indicator.
4. Can I use stochastic and RSI together?
Yes, you can use both together, but as a market analyst, I suggest not doing that. Stick to only one. If you are a conservative trader, stick to RSI and an aggressive trader, then choose stochastic RSI.