
Divergence trading is compelling in forex. There are many indicators like MACD, stochastic, and so on. But Rsi divergence is simple to understand and take the trades correctly.
What is RSI indicator-RSI definition
RSI is a momentum indicator that was first introduced in 1978. Forex traders use this indicator as a technical analysis tool. Relative strength index or rsi is found in both mt4 and mt5 platforms. The default settings of RSI are 30 and 70. The RSI line above 70 means the currency pair is overbought, and the rsi line below 30 indicates that the currency pair is oversold. However, another way we can use rsi to make a huge fortune in the forex market is RSI divergence.
What is a divergence
Suppose one entity deviates from another entity; that is divergence. In forex trading, one entity is the price itself, and the other entity is the indicator.
If price and indicator disagree with one another, that is divergence. In terms of technical analysis, if the price moves in the opposite direction of the relative strength indicator, That is rsi divergence. Both disagree if price makes lower lows, but rsi makes higher lows. Or if price makes higher highs, but rsi makes higher lows, then both of them disagree with one another. As they diverge from one another, it is called divergence. There are two types of divergence.
- 1. Bullish divergence or positive divergence
- 2. Bearish divergence or negative divergence
RSI Bullish divergence or positive divergence
If price makes lower lows, but rsi makes higher lows, that is a bullish divergence. It means that the bearish trend is over, and a new trend will start
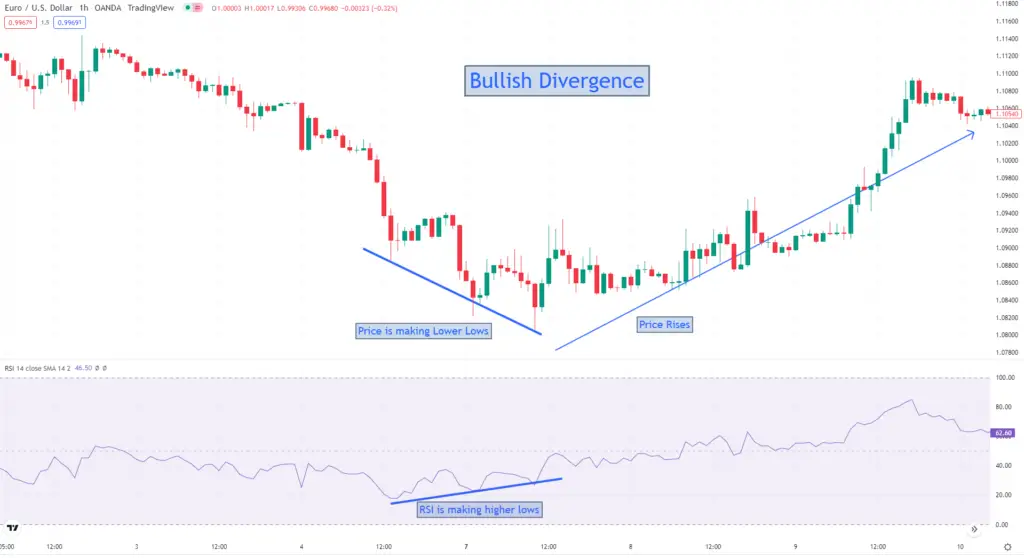
Look at the chart above. Price makes lower lows, but on the contrary, the Relative strength index indicator makes higher lows. What is the outcome? The outcome is price rises drastically. As the price rises positively, the other name for this bullish divergence is positive divergence.
Bearish Divergence or Negetive Divergence
If price makes Higher highs, but rsi makes lower highs, that is a bearish divergence. It means that the bullish trend is over, and a new trend will start.
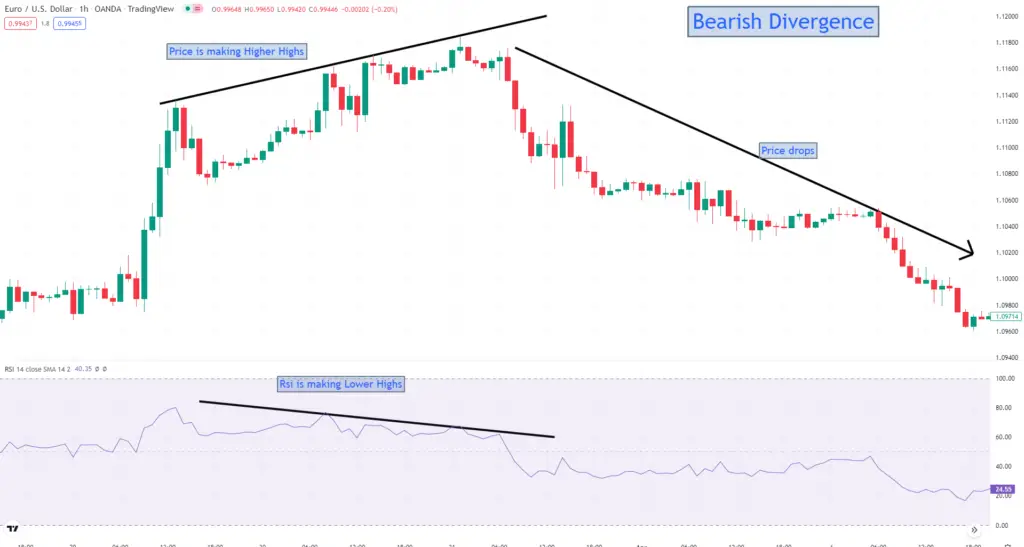
Look at the chart above. Price makes higher highs, but on the contrary, the Relative strength index indicator makes lower highs. What is the outcome? The outcome is price drops drastically. As the price falls negatively, the other name for this bearish divergence is a negative divergence.
Caution when trading RSI divergence
If you take every divergence, you will soon empty your balance. It would be best if you were very picky when choosing trade setups. Of course, at first, you need to ensure that there is a proper rsi divergence setup. But there is a divergence does not mean you will take the trade. I suggest waiting for the price action. If you combine price action with your rsi divergence setup, then the chances of your winning in that trade increase!
For example, in Bullish divergence, wait for a substantial bullish bar, and in bearish divergence, wait for a healthy bearish candle. The position is also an important factor here. It will be an ideal setup if you find signals at the end of any sharp trend.
Trading strategy using RSI divergence indicator
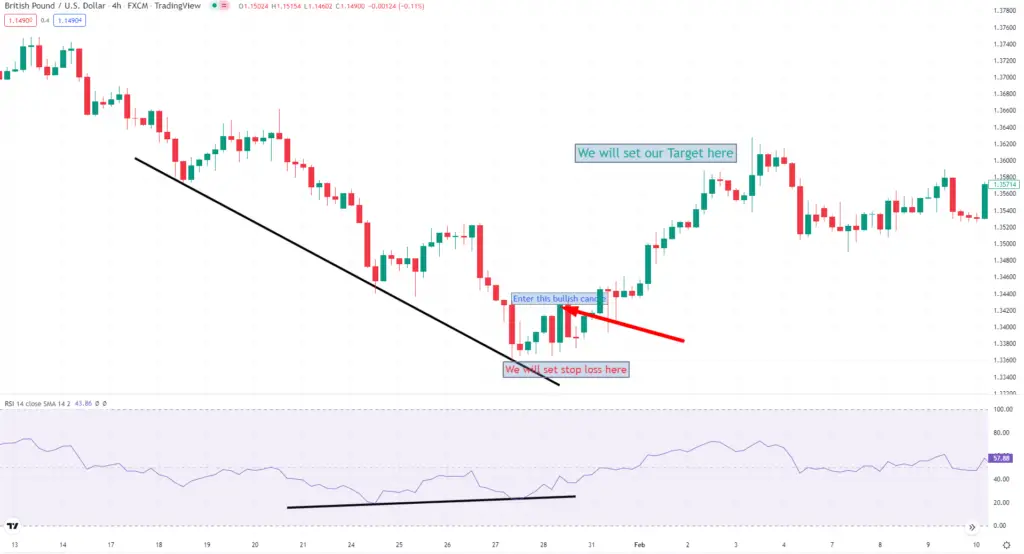
Take a look at the setup above. We find lower lows in price but higher lows in the rsi indicator. That means this is a valid divergence. Now we will search for a healthy or big bullish candle. Until we find this bullish candle, we will not enter the market. After five candles, we find this bullish signal candle. Now, we will enter the buy setup. Look how beautifully the price rises after we enter the market. Our stop loss will be below the recent low from entering the market. We will set 1:2 risk-reward as our take profit.
We found that price moves in our desired direction and gives us profit.
To sell trade, you need to do the opposite. This means searching for a strong bearish candle after you find the divergence. When you find a strong bearish candle, the chances of winning this trade increase.
FAQs
1. What is an RSI divergence
RSI divergence is a trading strategy used by forex traders. Many forex traders are making a fortune using the rsi divergence strategy.
2. Is RSI divergence a good strategy?
Yes. RSI divergence is an excellent strategy. But if you take every signal you get from divergence; you will lose many of them. The best outcome you will get is if you combine price action with the rsi strategy.
3. What happens when RSI divergence?
When RSI divergence happens, two things happen. In bullish divergence, the price goes up, and in bearish divergence, the price goes down.
4. Which time frame is best for RSI divergence?
You can use any time frame longer than 15 minutes but for getting the best output, stick to 60 minutes only.
5. What does rsi stand for or what does rsi mean
RSI stands for relative strength index