
This support and resistance zones indicator is a custom indicator based on the Esaz system and Gann theory. The indicator is divided into three categories, each of which is designed for a specific period. The indicator draws levels and figures in the form of rhombuses on the chart, the sides of which can be used as trend guides and resistance/support lines. Let’s take a closer look at how the Esaz indicator works and how to use its lines in trading.
Esaz support and resistance zones indicator-How does it work?
There are three types of support and resistance zones indicator.
- Daily support and resistance zones indicator time frame D 1.
- Weekly support and resistance zones indicator time frame W 1.
- Monthly and resistance zones indicator-time frame Mn 1.
The indicator is based on Gann’s theory. This is a predictive algorithm. It builds levels according to the Gann Box principle, defining the key boundaries from which the price repels. The indicator lines can be used to predict the further price direction, trend reversal points and other market situations.
Esaz constructions look like rhombuses. Other lines pass through each figure – Esaz constructions look like rhombuses. Other lines pass through each figure – horizontal, diagonal, vertical. Some of them are highlighted in a separate color. You can determine the key lines of support and resistance levels on the sides of the figures.
Highlighted in blue is the pivot level that passes through the diamond-shaped figure. Highlighted in blue is the pivot level that passes through the diamond-shaped figure. This is the main turning point. By the position of the price relative to this line, one can judge the type of trend
- If the candles are above this line, then you should only look for long entry points.
- If the candles are below the blue pivot line, then short entry points should be determined.
The sides of the diamonds, which are located at an angle to the chart, corresponding to the Gann angles. Horizontal straight lines are support and resistance levels.
How and where can I download the Esaz support and resistance zones indicator?
Download support and resistance zones indicator mt4 from here. This is daily file. Weekly and monthly is given below. The file that you downloaded must be copied and placed in the “Indicators” folder located in the data directory. This installation manual is suitable for Meta Trader terminals. Recall that you can open the data directory through the “File” menu or the keyboard shortcut Shift + D + Ctrl. You need to install all three versions of the indicator – for Mn 1, W 1 and D 1
Each type of Esaz support and resistance zones indicator is configured separately. The main parameter is “Style”, which is responsible for the type of levels that the indicator will build. The second most important parameter is “Count_Days/Count_Period”. It shows the number of series of Gann boxes that will be plotted on the chart. By default, the indicator builds only one series of diamonds, which is optimal for most trading schemes. If you need to increase this number, then simply enter the desired value in the “Count_Days / Count_Period” column.
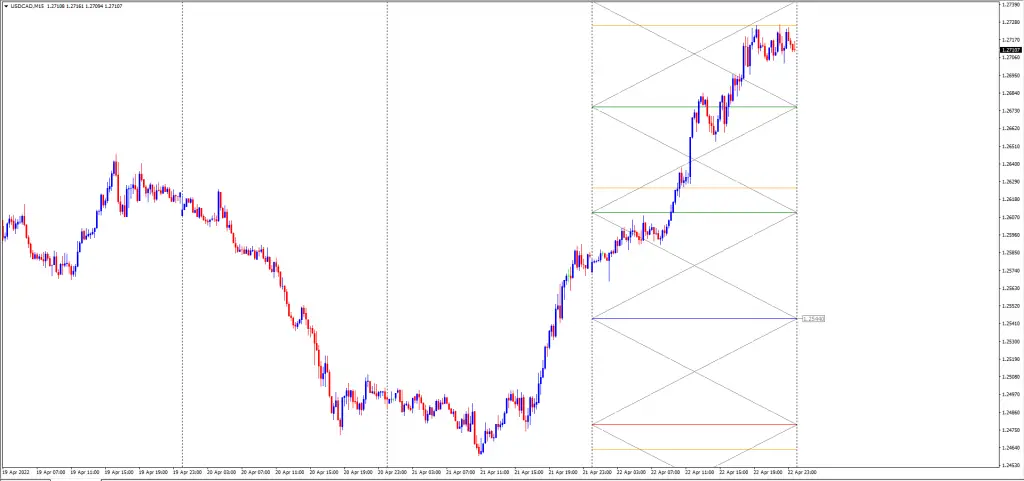
An example of Esaz indicator levels is shown in the screenshot below. Pay attention to how the price moves relative to the levels of this instrument.
Support and resistance zones trading system
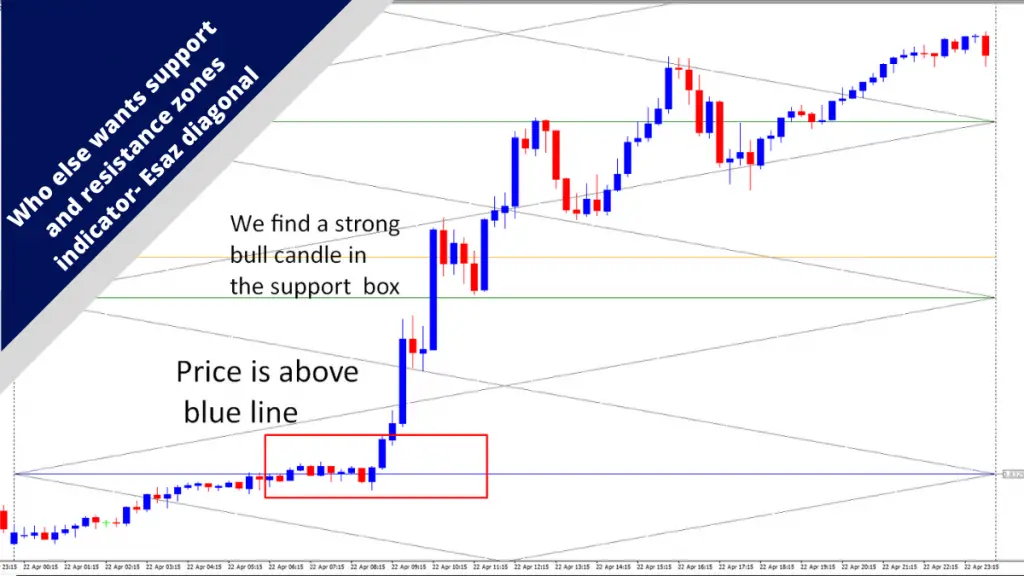
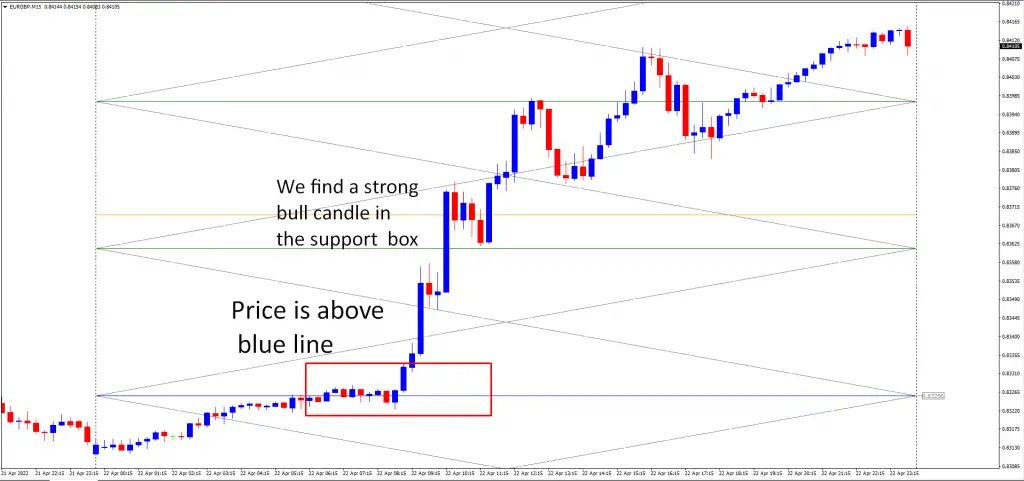
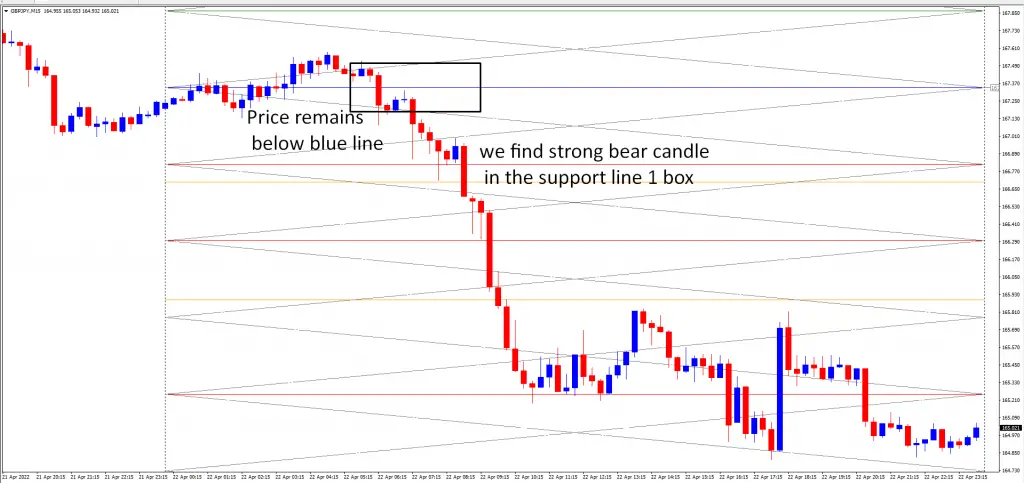
when the price stays below the blue line, then you need to search only for sell trades, and when the price stays above the blue line, you need to search only for buy trades.
Suppose the price is above the blue line, and you find a strong bull candle formed in the support 1 line’s diagonal box, then place a buy trade. Your protective stop loss should be above the blue line. Target support3 line for your take-profit zone. Just take a look if you took this trade, how much profit you could make
Suppose the price is below the blue line, and you find a strong bearish candle formed in the resistance 1 line’s diagonal box, then place a buy trade. your protective stop loss should be above the blue line. Target support3 line for your take-profit zone. Take a look at the yummy sell setup
I used here daily Esaz support and resistance zones indicator and input 15 minutes time frame. You can apply 4-hour time frame on the weekly chart and the D1 time frame on the monthly chart.
Anatomy of Daily Esaz support and resistance zones indicator
This tool draws a diamond-shaped box on the chart corresponding to the daily timeframe. That is, this algorithm is suitable for trading within one day.
Daily Esaz is used for scalping trading, as well as for opening short-term trades. The recommended time frame for trading is from fifteen minutes .
The blue horizontal is a pivot level. Green lines are resistance levels and red lines are support levels.
In the settings, you can separately adjust the value of the period for calculating the levels, as well as the value of the Greenwich time shift. However, you should not change these settings during the first installation. First test the tool on the base settings to see if you need to change anything at all.
You can easily check if you need to adjust the time shift. Plot a diamond-shaped box on graph 1. The plumb lines of the figure should be at the level of 00:00 hours. For convenience, you can manually mark the beginning and end of the day with vertical lines.
If the plumb lines are at a different level, then using the “Shift – Shift” parameter, they must be brought to the 00:00 mark.
Anatomy of Weekly Esaz support and resistance zones indicator
The Weekly Esaz version draws levels on the chart showing the dynamics of price changes over the past week. This tool is well suited for trading on timeframes from 4-hour and higher.
The indicator plots steep blue lines on the chart, which show the direction of the price. You can change the color and type of these lines using the “Style” parameter:
- If set to 0, then the lines will be continuous.
- If you set the value to 1, then the lines will be drawn with a large dotted line
- With a value of 2, the lines will be highlighted with a small dotted line.
- The value 3 is responsible for highlighting with the middle dotted line.
- If you add a value of 4, then the lines will consist of continuous and dashed segments.
Download support and resistance zones indicator mt4 weekly.
Anatomy of Monthly Esaz support and resistance zones indicator
This version of the indicator shows a diamond-shaped figure on the chart, showing the dynamics of the price movement during the past month. Monthly Esaz is suitable for long-term trading strategies where one trade can be active for several days or even weeks.
The indicator is used on the four-hour and daily time frames. Monthly Esaz displays important key levels that influenced the price movement during the whole month.
Download support and resistance zones indicator mt4 monthly.
Cautions while using Esaz support and resistance zones indicator
Esaz can be used as a predictor. By its levels, you can determine where the price can linger for a while and make a rebound, and where the candles will confidently break through the chart and go further.
The tool does not provide ready-made signals and does not have any additional features such as an alert or sending messages to the user’s email. It simply draws diamond shapes on the chart based on the Gann Box. According to the diagonal lines of the figures, you can determine the direction of price movement in the near future.
However, Esaz’s testimony is not always correct. Do not forget that this tool only fixes the price movement in previous periods and determines the key levels and zones. In the future, the chart can behave in any way, since everything depends on the current situation on the market, the actions of the largest players and market makers, the economic situation in the world, etc.
The Esaz indicator has one big advantage – if necessary, its figures can be moved back a certain number of bars. This feature will be useful if a trader decides to evaluate the accuracy of Esaz plots on history and, if necessary, adjust the settings. Thus, you can adapt the indicator for any currency pair or other trading instrument.
Any version of Esaz can be used in combination with other technical tools. When trading with the trend, it is combined with MACD, parabolic, moving averages or other trend tools. By the levels of Esaz, a trader can determine the expected reversal points, rollback / trend correction. Often the tool is combined with volume indicators.
The indicator is not suitable for news trading. Therefore, an hour before and after the publication of important economic news, it should be turned off. Esaz can be used for both scalping and trend trading. This is a versatile tool that is suitable for different strategies.
Conclusion
If you are a technical indicator based trader, then the support and resistance zones indicator is a must-have tool for you. Many traders searched this custom indicator many where but couldn’t find it. That’s why I am giving it to you all, guys. Just download the indicator, follow the guidelines and make money from the forex as much as you want.
