
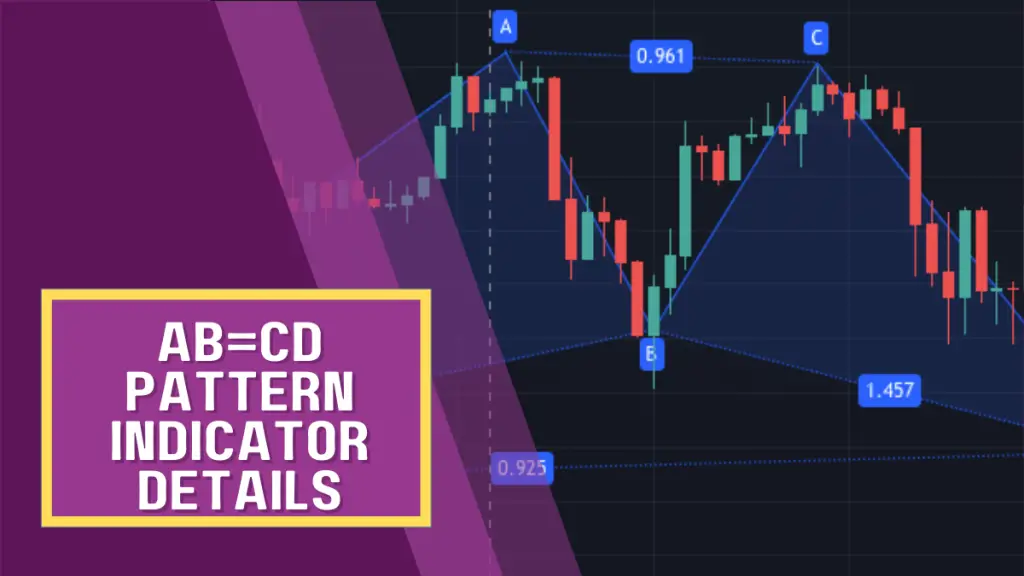
The ab=cd pattern indicator is a technical indicator that looks for harmonic price patterns in the market. It is used to look for points where price might change trends, but not only restricted to finding reversals, but it can also help traders stay in trades or find their exit points during a trade. The abcd pattern strategy is popular amongst other strategies that professional traders use. There are different and versatile combinations of indicators commonly used to ramp up the chances of trade success of the strategy.
You have to acknowledge with indicators that they are not 100% fail-proof. Because market conditions are not consistent, so the inconsistency can also play a role in the success or failure of a setup, but these patterns can make you rich if mastered and approached correctly, the pattern can be used to predict bullish or bearish reversals in trending markets so that is the most favourable market condition at which you can use the ABCD pattern to identify the next move in price.
After studying the Gartley patterns, Scott Carney and Larry Pesavento discovered the ABCD pattern. The pattern is what we would call a vector or measured move because it shows a harmony between price action and time.
The relationship of price and time in the AB=CD pattern strategy is that the amount of distance and time between points A and B IS EQUAL to the amount of the distance and time that price moves from point C to point D.
Bearish ABCD
The bearish abcd pattern forms when the price was previously in an uptrend and gives a zigzag pattern that moves in an equal distance at an equal period of time; the patterns may vary in terms of the time they take to complete the pattern. Still, one thing that remains consistent is that the AB will take up half of the time segment, and CD will take the other half to complete the period.
The pullback or bc must at least be 50% or 61% retracement of ab to qualify as an ABCD pattern.
The image above is a representation of a bearish ABCD pattern. When approaching a bearish ABCD your aim is to sell when price reaches point D.
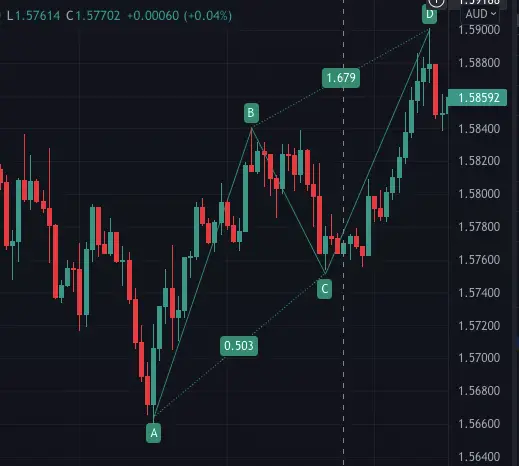
Bullish ABCD
The bullish ABCD will form after a Downtrend, and the buy entry will be at point D of the pattern. Knowledge of price action patterns will come in handy when it comes to entering the trade because you will need to confirm the entry using a nameable candlestick pattern to validate the entry of your trade and to make sure you don’t take unnecessary losses.
The image above represents a bullish ABCD pattern.
Gartley patterns
The strategy consists of different patterns which are adopted from other patterns like the Gartley pattern which was created by H.M Gartley, Gartley was the inspiration behind the creation of the ABCD pattern,in his technique of analyses he didn’t use the Fibonacci indicator so Scott and Larry implemented the usage of the Fibonacci to create their pattern strategy.
The gartley pattern also known as the XABCD pattern consists of the Bullish Gartley and the Bearish Gartley and like most of the patterns in price action, they have a repetitive nature, making it easy for traders to adopt this type of market analysis strategy.
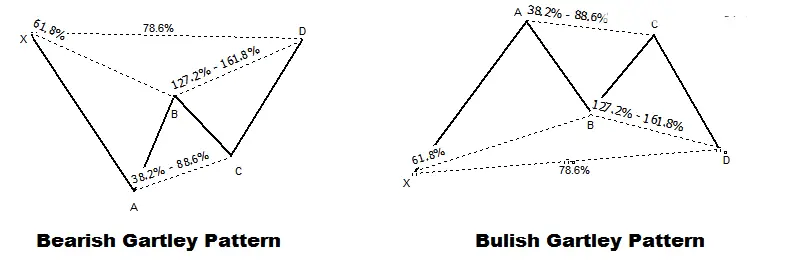
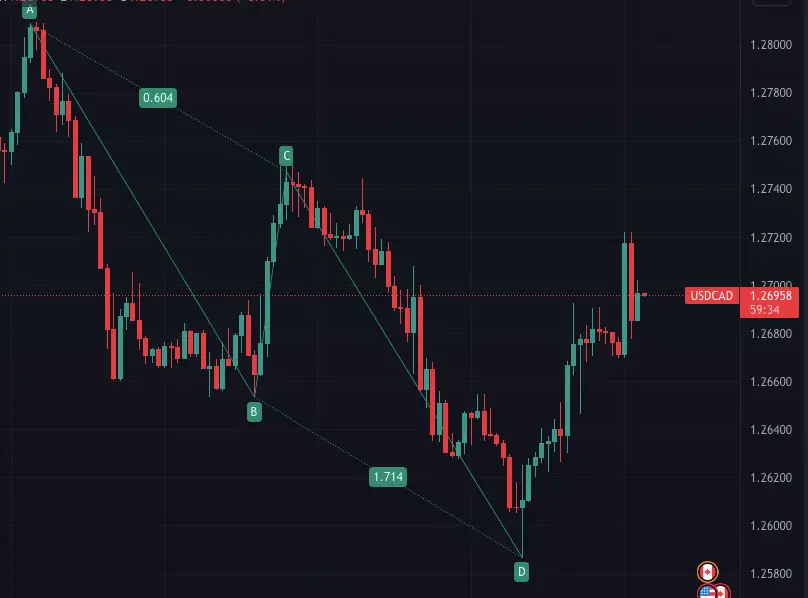
Bearish Gartley
In the case of the “Bearish Gartley pattern, you would enter a sell trade when the price reaches point D of the cycle, and your stop loss will be determined by your risk/ reward strategy; multiple trades may also be entered where you can even have a short term, midterm and long term profit target, this type of entry strategy is common when trading the strategy as you can use the Fibonacci as a guide for your targets.
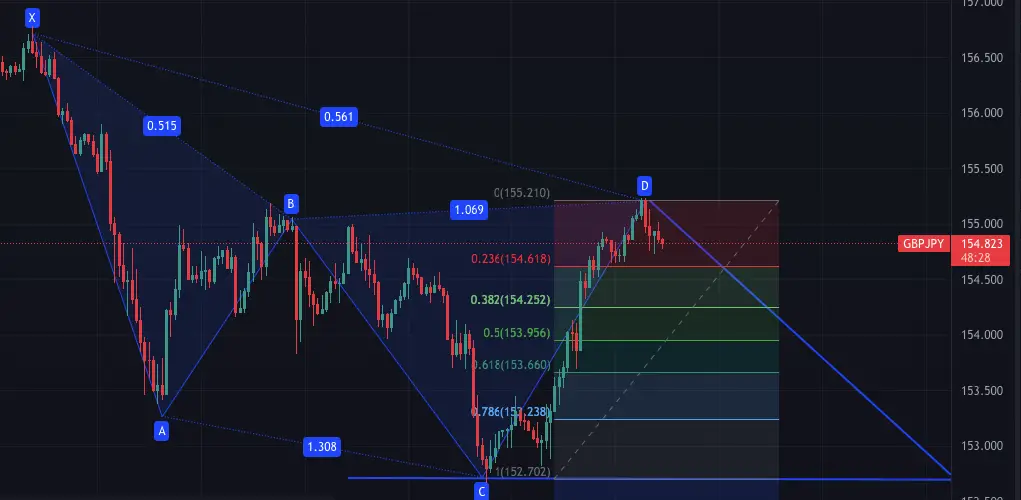
The image above shows a possible ABCD Bearish Gartley setup. In this situation, a sell trade is what you would be looking to take as the price has made a correction and is going to change direction to a bearish trend.
The setup plays as expected and makes a 61% retracement. This is just an example of how you would analyse and take a bearish Gartley setup.
Entry rules
- Look for the Gartley pattern
- Confirm pattern using AB=CD pattern indicator
- Look for entry signals such as bearish candle pattern
- Sell when the bearish candle pattern is confirmed.
- Apply risk management accordingly(stop loss / take profit)
Bullish Gartley
The bullish Gartley approach will be the opposite of the bearish Gartley as you will enter a buy trade when the price reaches point D of the bullish Gartley, and your targets and stop loss will be determined by your risk/reward strategy.
There are other indicators that you can use to easily identify ABCD patterns besides the AB=CD pattern indicator, one being the ZIGZAG indicator. This forex indicator draws straight lines between swing points in price to plot accurate ABCD abcd diagrams that you can use to form your direction bias and build a trading plan.
One important factor to consider is that most of these patterns will retrace to either 50% or 61%, so when formulating your forex strategy, you have to consider these points as your first and second profit areas.
Entry rules
- Look for a Gartley pattern
- Confirm pattern using AB=CD pattern indicator
- Look for entry signals such as bullish candle pattern
- Sell when bearish candle pattern is confirmed
- Apply risk management accordingly(stop loss/take profit)
Conclusion
Harmonic patterns are one of the best technical analysis tools, and they can help you realise your financial goals; another important thing is studying them so that you can analyse them as they happen.
FAQs
Q. How do I identify AB CD pattern
A. By using the AB=CD pattern indicator to find impulses that have an equal distance and time.
Q. Is ABCD pattern bullish
A. The ABCD pattern can be bullish or bearish depending on the trend direction.