
Buy-sell signal indicators are technical analysis tools that provide real-time insights into the market’s potential buy or sell opportunities. Analyzing various market factors, they offer cues on when to enter or exit trades. This section helps you understand how these indicators work and their importance in trading.
Features of a Good Buy Sell Signal Indicator: What to Look For?
When looking for the right buy-sell signal indicator, certain characteristics stand out:
- Accuracy: The indicator should provide precise signals.
- User-friendly: Ease of understanding and application.
- Real-time Updates: Timely alerts for effective trading.
- Compatibility: Should work with various trading platforms.
Top 5 Best Forex Buy Sell Signal Indicators: A Detailed Look
Here, I dive into five renowned indicators known for their effectiveness, reliability, and popularity among traders.
Moving Average Convergence Divergence (MACD)
MACD is a popular technical tool traders, and investors use to understand trends in financial markets.
It is a versatile indicator that helps traders identify potential signals. It’s commonly used in stock trading, foreign exchange (forex) markets, and other investment areas. The MACD is calculated using moving averages, smoothed lines representing an asset’s average price over a specific period.
Here’s how it works:
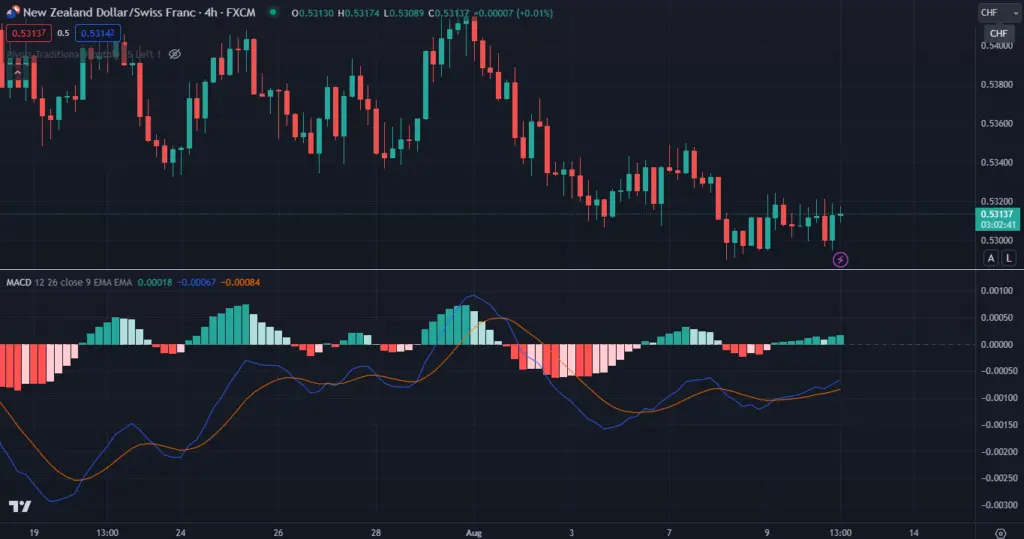
Calculation of MACD Line: The MACD consists of two main lines – the MACD line and the signal line. When you subtract 12 EMA from 26 EMA, you will get the MACD line. These EMAs give more weight to recent prices, making them responsive to short-term price movements.
Signal Line: The signal line is a 9 EMA of the MACD line. It acts as a trigger for signals. When the MACD line crosses above the signal line, you will get a buy indication, suggesting that the asset’s price might rise. On the other hand, when the MACD line crosses below the signal line, it produces a sell indication, indicating a potential price decline.
Histogram: The MACD histogram is derived from the difference between the MACD and signal lines. It visually represents the divergence (gap) between these lines. When the histogram bars are above the zero line, it indicates bullish momentum, while bars below the zero line suggest bearish momentum.
Traders use MACD in various ways
- Trend Identification: When the MACD line is above the signal line, and both are above the zero line, it suggests a strong uptrend. Conversely, when the MACD line is below the signal line, and both are below the zero line, it indicates a downtrend.
- Crossovers: Traders pay attention to MACD line and signal line crossovers. A bullish crossover (MACD line crosses above the signal line) can signal a potential buying opportunity. A bearish crossover (MACD line crosses below the signal line) may indicate a potential sell signal.
- Divergence: MACD divergence occurs when the MACD line diverges from the price movement. It indicates a potential reversal in the current trend.
- Histogram Analysis: The histogram’s height and direction can give insights into the trend’s strength. Larger histogram bars indicate stronger momentum.
Remember, while MACD is useful, it’s not always 100% accurate. It would be best if you combined it with other indicators and analysis methods to understand the market completely. Traders often combine MACD with indicators like Relative Strength Index (RSI) or Moving Average Crossovers for more accurate results. The MACD is a widely used technical analysis tool that helps traders identify trends, potential entry and exit points, and shifts in momentum in financial markets.
Relative Strength Index (RSI)
The Relative Strength Index is a tool used in technical analysis to gauge the strength and potential direction of a financial asset’s price movement. It’s a widely used indicator among traders and investors to help make informed decisions.
The RSI is a numerical indicator that ranges between 0 and 100. It’s based on the concept that when a price rises, its momentum increases, and when it falls, its momentum decreases. The RSI compares the magnitude of recent price gains to recent price losses over a specific period, typically 14 periods. This period can be adjusted to suit different trading styles and timeframes.

Interpreting RSI Readings
- Overbought Zone (Above 70): When the RSI crosses above 70, it suggests that the asset might be overbought, meaning its price has risen too quickly, and a potential reversal or pullback could be on the horizon. Traders might consider selling or taking profits in this situation.
- Oversold Zone (Below 30): The asset might be oversold when the RSI falls below 30. This suggests that the price has dropped rapidly and could be due for a rebound. Traders might consider buying or taking long positions in this scenario.
Divergences
RSI can also provide insights through divergence. If the asset’s price moves in one direction while the RSI moves in the opposite direction, it could signal a potential reversal in the price trend.
Bullish and Bearish Divergence:
- Bullish Divergence: Occurs when the price makes lower lows while the RSI makes higher lows. This could indicate that even though the price is decreasing, the momentum behind it is weakening, potentially leading to a price reversal upwards.
- Bearish Divergence: This happens when the price makes higher highs while the RSI makes lower highs. In this case, the price is increasing, but the momentum is fading, indicating an upcoming downward price movement.
Limitations
While the RSI is a valuable tool, it’s important to note that no indicator is foolproof. Sometimes, assets can remain overbought or oversold for extended periods before reversing. Additionally, sudden news events can disrupt the expected patterns.
In conclusion, the Relative Strength Index is a versatile tool for traders and investors to understand the momentum behind price movements. By identifying overbought and oversold conditions and analyzing divergences, the RSI can help make more informed decisions in the dynamic world of finance. Combining RSI with other indicators and analysis methods can provide a more comprehensive market view.
Bollinger Bands
Bollinger Bands are a popular tool. It is used in forex, stock, and future markets. They were developed by John Bollinger in the 1980s and are designed to provide insights into price volatility and potential price movements of a financial instrument, such as stocks or currencies. Bollinger Bands have three key components: the middle and two outer bands.
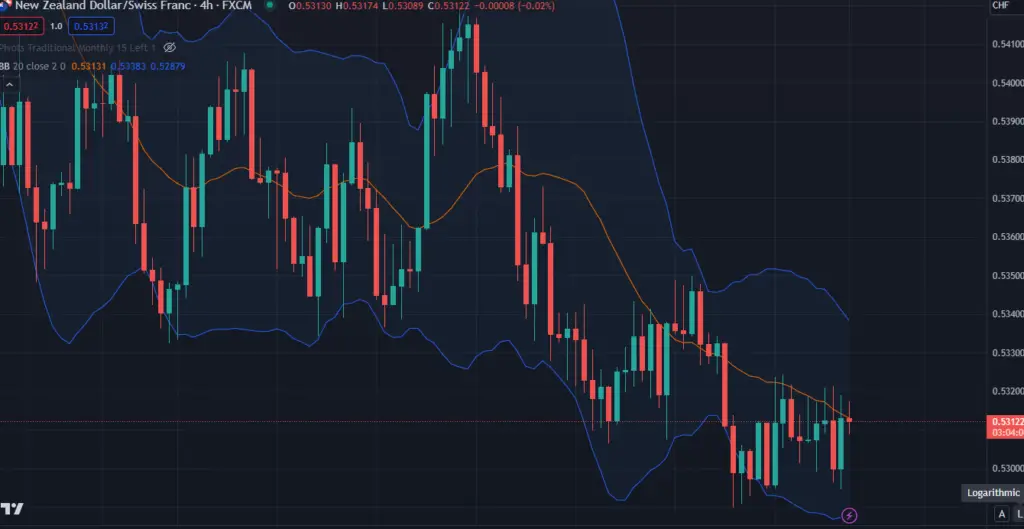
- Middle Band: The middle band is typically a simple moving average of the asset’s price over a certain period. The most common period used is 20 days, but traders can adjust this value based on their preferences and the time frame they are analyzing.
- Upper Band: The upper band is calculated by adding a certain number of standard deviations (usually 2) to the middle band’s value. Standard deviation is a measure of volatility, so by adding it to the middle band, the upper band expands when the price becomes more volatile.
- Lower Band: You get a lower band when subtracting the same number of standard deviations from the middle band’s value. It contracts when the price volatility decreases.
Bollinger Bands are a powerful tool for traders because they provide visual cues about the market’s volatility and potential trend reversals. When the price moves close to the upper band, it might indicate that the market is overbought, meaning the price may soon decrease or stabilize. Conversely, when the price nears the lower band, it could signal an oversold market, suggesting that the price might rise or level out.
It’s important to note that Bollinger Bands are not a standalone indicator for making trading decisions. Traders often use them with other technical indicators or fundamental analyses for a more comprehensive market view. Also, Bollinger Bands are more effective when used in trending markets than markets with low volatility.
In summary, Bollinger Bands are a widely used tool in technical analysis that help traders gauge market volatility and potential price movements. By understanding the relationship between the price and the bands, traders can make more informed decisions about buying, selling, or holding currency pairs. Remember, like any trading tool, Bollinger Bands should be part of a broader strategy and not solely relied upon for decision-making.
Stochastic Oscillator
Traders and investors use Stochastic Oscillators to help identify potential price reversals in financial markets. It’s particularly useful when analyzing stocks, forex, and other assets. The oscillator provides insights into whether an asset’s price is overbought or oversold.
The Stochastic Oscillator is based on the idea that as a price trend accelerates, the price tends to close near its high during an uptrend and near its low during a downtrend. It compares a specific closing price of an asset to a range of prices over a certain period, often 14 days. The high and low prices determine this range within that timeframe.
Here’s how it works:
- The oscillator consists of two lines: %K and %D.
- %K, also known as the fast line, represents the current closing price’s position within the selected price range. It shows the momentum of the price change.
- %D, known as the slow line, is a moving average of %K. It helps smooth out the fluctuations and provides a more stable view of the asset’s trend.
The Stochastic Oscillator generates values between 0 and 100. These values are interpreted as follows:
- When the %K line crosses above the %D line and is below 20, it suggests that the asset might be oversold, and a potential upward price movement could occur.
- Conversely, when the %K line crosses below the %D line and is above 80, the asset might be overbought, and a potential downward price movement might follow.
Traders often use the Stochastic Oscillator and other technical indicators and chart patterns to confirm trading decisions. However, it’s important to note that no indicator is foolproof, and false signals can still occur. The Stochastic Oscillator and other analysis methods and risk management strategies are recommended.
In conclusion, the Stochastic Oscillator is a valuable tool in technical analysis, helping traders identify potential reversals in price trends. Indicating overbought and oversold conditions provides insights into the market’s momentum and assists traders in making more informed trading choices. While this tool can be insightful, successful trading requires a combination of analysis techniques and risk management.
Fibonacci Retracement
Traders and investors use Fibonacci retracement to predict potential price levels in financial markets. Named after the 13th-century mathematician Leonardo of Pisa, also known as Fibonacci, this tool is based on a sequence of numbers known as the Fibonacci sequence.
The Fibonacci sequence starts with 0 and 1, and each subsequent number is the sum of the two preceding ones: 0, 1, 1, 2, 3, 5, 8, 13, 21, and so on. This sequence has interesting mathematical properties and is found in various natural phenomena.
In the trading context, Fibonacci retracement is used to identify potential support and resistance zones in a price trend. Traders believe that after an asset’s price makes a significant move, it is likely to retrace or pull back before continuing in the direction of the trend. This retracement is often measured using the Fibonacci ratios derived from the Fibonacci sequence. The most commonly used ratios are 23.6%, 38.2%, 50%, 61.8%, and 78.6%.
Here’s how Fibonacci retracement works:
- Selecting Points: Traders identify two points on a price chart: the starting point of the price move (usually a low) and the ending point (usually a high or vice versa). These points are used to define the trend.
- Calculating Levels: The Fibonacci retracement levels are then drawn on the chart. These levels represent potential support or resistance areas where the price might reverse its direction. The retracement levels are calculated based on the percentage ratios mentioned earlier.
- Predicting Reversals: Traders watch for price action around these levels. If the price retraces to one of these levels and shows signs of reversal, it could indicate a potential buying or selling opportunity, depending on the direction of the trend.
It’s important to note that Fibonacci retracement is just one tool among many in the technical analysis toolkit. While some traders place a significant amount of weight on Fibonacci levels, others use them with other indicators.
In conclusion, Fibonacci retracement is a simple yet effective tool traders use to predict potential price levels in financial markets. By applying the ratios derived from the Fibonacci sequence to key points on a price chart, traders can identify possible support and resistance areas, aiding their decision-making process. As with any trading tool, using Fibonacci retracement with other indicators and analysis methods is advisable for a well-rounded perspective on market trends.
