
The moving average is a technical indicator. The rising moving average hints that the Currency pair is in an uptrend. On the contrary, the declining moving average hints that the currency pair is in a downtrend. Forex traders or stock market traders use this technical indicator to smooth out price data. If you want to know how to distinguish market noise and actual trend direction, then you must know what is a moving average indicator and how to use it.
What is moving average indicator
Suppose you take the average closing price of a currency pair or any particular stock for the last “X” number of periods that is the moving average. The moving average is calculated based on past prices and is a trend-following, lagging indicator. Here longer period means more lagging.
A 50-period 4-hour moving average is more lag than a 20-period 4-hour moving average. Because 50 periods of 4-hour moving average contain prices of the last 50 four-hour candles, bigger than the 20 four-hour candles.
We know that every technical indicator forecast future prices. As a technical indicator moving average does the same. Traders use various periods moving averages, shorter period moving averages for short-term trading, and longer period moving averages for long-term trending.
Types of Moving Averages
There are four types of moving averages in the forex market.
- Simple Moving Average -SMA
- Exponential Moving Average -EMA
- Smoothed Moving Average -SMMA
- Linear Weighted Moving Average -LWMA
Formula of different types of moving averages
Simple moving average formula
If you add the most recent data points and divide the total by the number of periods, you will get the simple moving average. Suppose the closing price of EUR/USD daily charts for the last 6 days are as follows: 1.0191, 1.0095,0.9918, 0.9822, 0.9644, 0.9548.
SMA = (1.0191+1.0095+0.9918+ 0.9822+ 0.9644+ 0.9548)/6
=0.9870
As the formula of SMA =(X1 + X2 + ……….Xn) / n
where, X is the average in period n
n is the number of periods
Exponential Moving Average formula
The exponential moving average gives more weight to the most recent price points. EMA is more responsive. A given day’s EMA calculation depends on the EMA calculations for all the days prior to that day. You need more than 6 days of price data to calculate 6 day EMA.
To calculate the exponential moving average, you need to go through 3 different steps.
First, you need to calculate the simple moving average for the selected period. As we calculate 6 period’s SMA earlier so, for calculating EMA, we assume that here our SMA is 0.9870.
Secondly, you need to calculate the multiplier for weighting the EMA.
The formula of calculating multiplier = {2/(selected time period +1)}
As we calculate sma with 6 period so here our selected time period is 6.
So the calculation will be, multiplier= {2/(6+1)}=0.2857=28.57%
Third, calculate the exponential moving average for each day between the initial EMA value and today. You need to use the price, multiplier, and the previous period’s EMA value to do this. Here I am giving the formula for 6 days EMA
EMA={Close – EMA(previous day)} x multiplier + EMA(previous day)
A 6-period exponential moving average applies a 28.57% weighting to the most recent price. A 6- period EMA can also be called a 28.57% EMA.
A 12 period EMA aplies a 15.38% weighting to the most recent price. ({2/(12+1)}=0.1538=15.38%)
Here the most interesting fact you need to observe is that the weighting for the shorter period is more than the weighting for the longer period. The fun fact is the weighting drops by half every time the moving average period doubles.
Smoothed Moving Average formula
The Smoothed moving average is one kind of mixture of SMA & EMA But with a longer period. For instance, 10 periods Smoothed moving average is almost equal to a 20-period Exponential moving average.
SMMA smooths out the price movement so that the long-term trend becomes less volatile and more noticeable.
When currency prices rise above the SMMA, traders buy that cyrrency pair. When the price falls below the SMMA, it hints traders are becoming bearish in that pair.
As you know, smoothed moving average is a mixture of SMA and EMA, so the calculating method of SMMA is a bit complex. But I am trying to explain it lucidly.
SMMA= (SMMA#-SMMA*+Close)/N
Here,
SMMA# – the smoothed sum of the previous bar
SMMA* – the previous smoothed moving average bar
CLOSE – The closing price at the time of calculation
N – the number of smoothing periods
Linear weighted moving average- LWMA
When you assign a higher weighting to recent price data but makes the moving average more pronounced, then it is LWMA. That is why many find similarities between EMA and LWMA.
The weighted moving average is calculated by multiplying each closing price of the series by a certain weight coefficient.
LWMA = SUM (CLOSE (i) * i, N) / SUM (i, N)
Where:
SUM — sum;
CLOSE (i) — current close price;
SUM (i, N) — total sum of weight coefficients;
N — smoothing period.
Advantages & Disadvantages of a moving average indicator
| Advantages | Disadvantages |
| The moving average indicator helps traders to identify support and resistance zones. | Sometimes moving average indicator is vulnerable to fake signals. |
| It provides constant forecasts. | Every technical indicator works with past data. The moving average is no different. |
| SMA is best for longer periods, like the daily chart. In contrast, EMA is best for short periods like 30 minutes or 60 minutes chart. | It’s a lagging indicator. |
| The moving average indicator is very simple to understand and implement on the chart. | You need to trade like bank traders if you trade using a moving average as it produces too many signals, so as a retail trader, you need to sort out bad trades from good ones. |
| You can use different moving averages on your chart at the same time. Like you can use 10 periods, 20 periods, and 50-period moving averages on the same chart & in the same timeframe. It gives you an edge to analyze the same market from multiple angles. | The moving average indicator does not respond to the fluctuations of the market. |
| You wonder why bank and hedge fund traders use moving average indicators to identify the trend. Most of cases, a 200 moving average is used in their analysis. So as a retail trader, if you use the moving average indicator, you are also doing the same research that professional market analysts do! | It is not possible to trade news trade using a moving average indicator. |
How to trade using moving average crossover
Moving averages help traders to determine when any new trend is about to happen and finish. If you want to maximize your profit, then you need to enter from the very beginning of the trend. Moving average can also indicate when you should take your profit and get out of the market.
There are three types of trends in the market, and the moving average can point out all of them.
- Short term trend
- mid term trend
- long term trend
Moving average crossover happens when 2 different periods moving averages cross over with one another. With a live example of GBP/USD you will better understand the moving average crossover.
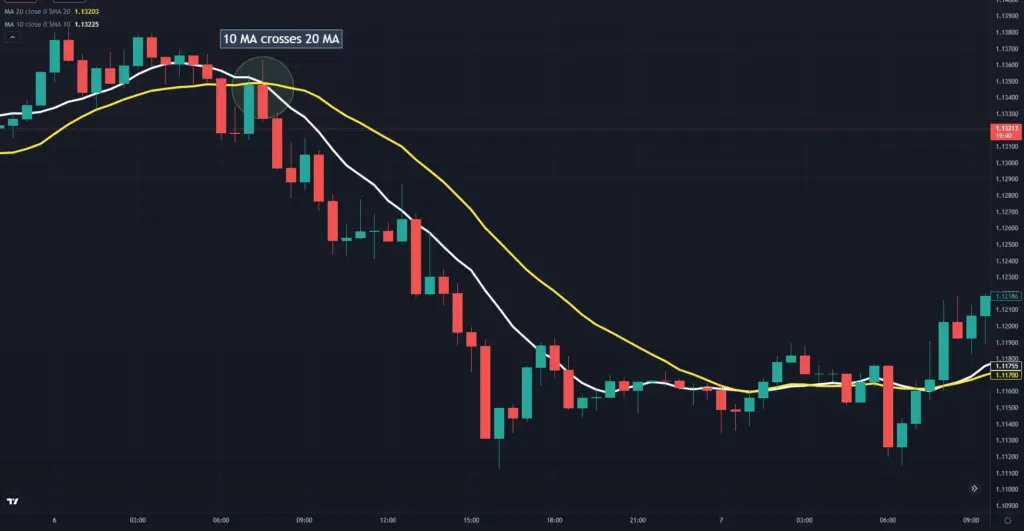
In this GBPUSD chart, we can see that at the 1.1349 price level, 10 MA crosses 20 moving average sharply. Price also rejected from that both 10 and 20 MA. If you could sell from there observing the crossover, then you could have made 189 pips! in a shorter time frame, like 30 minutes. Isn’t 189 pips a huge number?
In this trade, you get 189 pips, which doesn’t guarantee you will make this huge amount of pips in your every trade. Some trades will cut only 20/30 pips, also. But that’s okay as a shorter-term trader.
Even you could lose in some trades when trading with a moving average crossover strategy. But you shouldn’t be depressed in those losing streams, as you need to understand that these are all parts of the trading game.
Cautions when trading using the moving average crossover strategy
You will get tons of buy/sell signals in this strategy. But that does not necessarily mean that you will ride on every trend. It would be best if you sorted out bad entries from the good ones. Never ever trade on any choppy market. If you apply this moving average crossover system in a late Asian session, the chances are that you will lose most of your trades. You will always try to find entries on the volatile market, like in the US or London sessions.
Money management & Best time frame for trading with moving average crossover strategy
The best practice is to exit your trade when you find a reverse crossover. For instance, we observe that 10 MA crosses 20 MA from above. So when again 10 MA crosses 20 MA from below, then you need to close your sell position. Vice versa rules will be applied for buy setup.
You will get the best setups in 30 minutes and 60 minutes chart. Even some professionals call this 10 MA & 20 MA crossover the best moving average for 1 hour chart.
Take a look at another example of 1 hour chart. This time we will check a long setup.
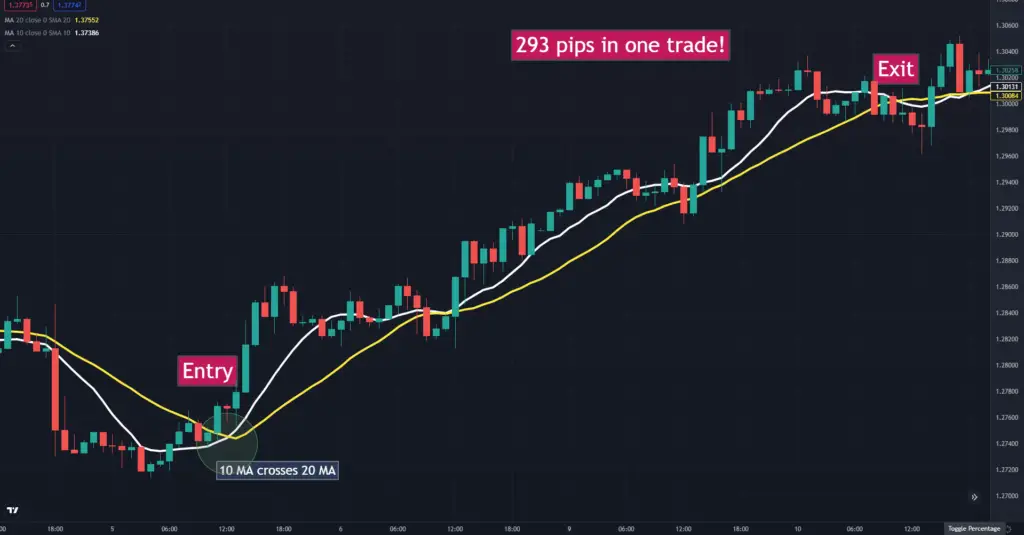
This is the best moving average for 1 hour chart. Look how beautifully 10 MA crosses 20 MA from below to above. You also see a couple of bullish candles. You can buy from here. The crossover happens at 1.2708. That is your entry point. Then again, 10 MA crosses 20 MA from above to below, which is your exit point. So your exit point is 1.3001. If you could take this trade, you could make more than 293 pips! Yes, you read it correctly 293 pips in just one single trade.
Best currency pairs to trade with moving average crossover strategy
Avoid trading slow pairs like
- EURCHF
- AUDCAD
- AUDCHF
- NZDCHF
- NZDCAD
Rather try to trade the most volatile currency pairs like
- EURUSD
- GBPUSD
- USDCAD
- GBPJPY
- AUDUSD
- NZDUSD
- NZDJPY
- AUDJPY
- EURAUD
- GBPAUD
- GBPCAD
- GBPCHF
In conclusion, If you want to master MA trading, then you need to know What is the moving average indicator, how to build a solid strategy based on moving averages, which pairs should you choose, what is the best time frame when trading moving average strategy and the limitations or cautions in moving average trading. This piece of content will answer all these subjects thoroughly.
