
The moving average is one of the most popular technical analysis indicator day traders use to identify profitable setups. But the problem is that if you don’t know which is the best moving average for day trading, then using the moving average could be lethal for you.
The right moving average or the right combination of some moving averages could be a great tool for you to survive the forex market. As a technical analyst, I must research various moving averages. I find that not only one but the combination of 3 different moving averages produces the best result. 5-8-13 combination of the simple moving average is the best moving average for day trading.
5-8-13 simple moving averages can catch some major market trends in London and US sessions. If you are also a moving average trader or love to trade using moving average, stick to only this combination. This 5-8-13 combination not only points out the exact entry point but also hints at when you should exit your position, making maximum profit.
5-8-13 Combination strategy: A best moving average strategy for day trading
Now, you already know that a 5,8,13 simple moving average combination is the best moving average combination for day trading. But if you don’t know how to use this combination, it is of no benefit to your trading. So, I will explain how you can enter the trade and find your exit point from the trade. I also show you false signals so you can avoid so many false signals produced by the 5-8-13 moving average combination.
Get moving average forecasting for buy setup
Here you use 3 different colors for 3 different moving averages. You can use any color. For instance
- White for 5 SMA
- Yellow for 8 SMA
- Blue for 13 SMA
The rules are very simple. You will find buy opportunities when observing 8 moving average is above 13 simple moving average, and 5 simple moving average is above 8 moving average. That means your sequence will be at the top 5 SMA, then 8 SMA, and at the very bottom 13 SMA. When you get this sequence, be sure that when the price bounces from the sequence, is there any bullish candle generated or not? Buy from there if you find a robust bullish candle in that bounce point. A live example could make you more clear of this point of view.
Take a look at the below picture to understand better what I have narrated here.
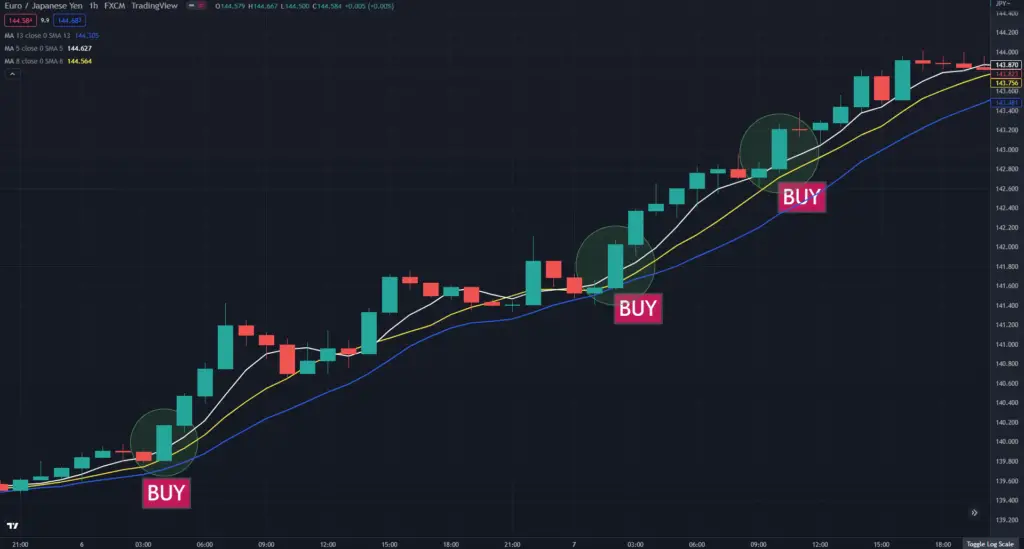
See, you get the sequence here. First white curve line is white(5 SMA), then the yellow curve (8 SMA), and at the bottom there, you get a blue curve(13 SMA). Notice that every time price gets closer to this combination, the price bounces back from the sequence with a bullish candle, which is a perfect buy setup for you.
If you could take these three trades, you could make a huge profit in just One EUR/JPY pair within a short period. Just imagine if any day trader who trades in 15 minutes, 30 minutes, or 1-hour timeframe gets this strategy; how much money could he generate? He will get countless trades with this strategy.
Find sell setup in 5-8-13 moving average method
Now I will show you how you can sell using this method. All the rules will be applied but conversely. Now 13 simple moving average will lie on top, then at the middle 8 simple moving average and below it 5 simple moving average. When you find this sequence be sure that there is a strong bearish candle bouncing back from that resistance zone. If you find a robust bearish candle, that is the perfect setup you are searching for.
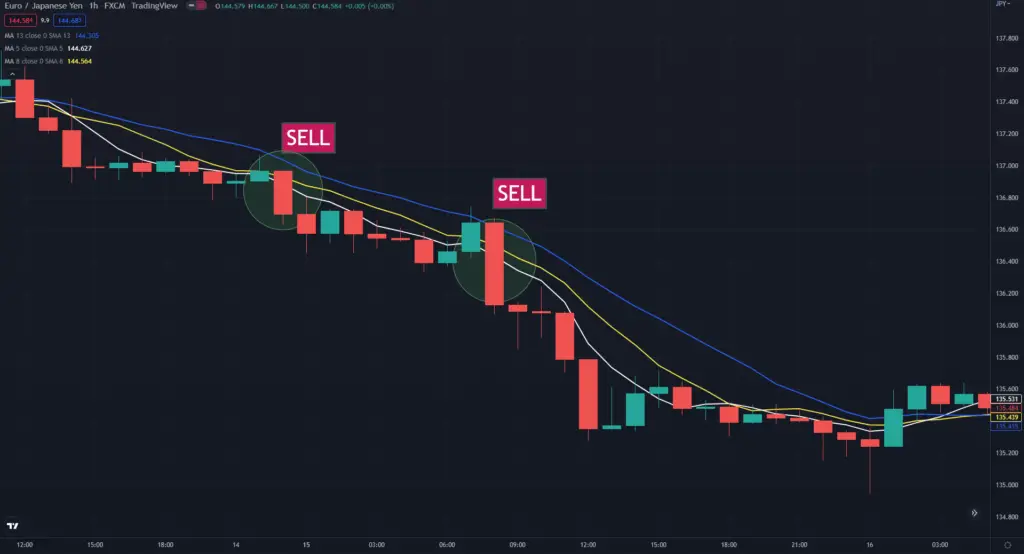
Here at the top, you get a blue curve or 13 SMA, and in the middle yellow curve or 8 SMA, and at the bottom, you get 5 SMA or a white curve. A perfect combination of the triple moving average. Now when you search bearish candle, you find that at the first trade, a robust bearish candle bounces back from the triple moving average combination. Take the trade. After some time, you get another opportunity with a strong bearish candle again. Again take the trade.
Voila! You take multiple trades in one pair within a very short period. Isn’t it fantastic?
False signals generated by the best moving average for day trading and how to avoid them
Every technical indicator produces false signals, and the moving average is no different. 5-8-13 combination moving average can also produce false signals, but you need to sort them out. If you could sort out them, you would be able to stay out of these trades very easily.
When the sequence is not perfect, then don’t take trades. For instance, for a bullish setup, if you find 5 SMA is below 13 SMA or 8 SMA is above the 13 SMA, Then don’t take the trade. Similarly, If you observe the sequence is in the wrong order for a sell trade, then avoid the trade.
One more thing needs to remember even if your sequence is perfect, that does not mean there is a trade for you. You must get robust green or red candles to buy and sell trades. Live examples of false signals would be great to make you all understand what I am trying to make you understand.
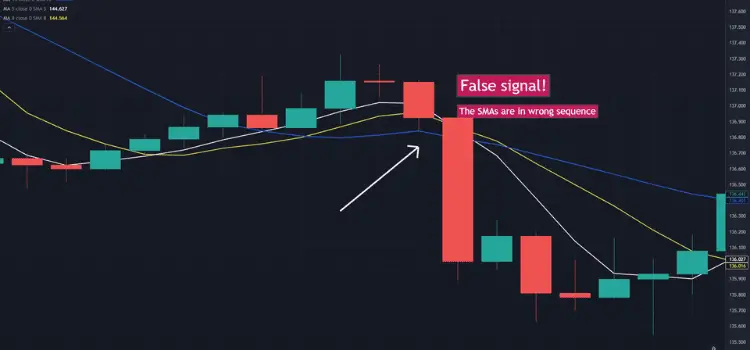
Look, although you get a very strong bearish candle, that doesn’t necessarily mean that there is a trade. When you check whether the sequence is in the right order or not, you find that the sequence is not in the right order. So don’t take the trade.
Finding The best moving average for day trading or a combination of the best moving average for day trading is quite difficult for newbies and professionals. Those who are making a continuous loss in forex, if they stick just with this one 5-8-13 SMA combination strategy and follow every rule of the strategy, then within one month, will start to make money. Those traders will come on a winning streak from losing!
