
As banks and hedge funds hold positions for longer, they need to get a longer-term trend direction. 200 day moving average is treated as a leading indicator by top-class technical analysts to determine overall market trends. So banks and hedge funds choose it over all other moving averages. In this content, I will not only discuss why 200 Day Moving Average is crucial but also show an exclusive strategy using this 200 SMA that big banks and hedge funds use!
Key factors of 200 day moving average
- 200 SMA is pictured as a curve line on charts and speaks for the average price over the past 200 days.
- Traders often heard about the golden crossover, a very profitable strategy. And this golden crossover is made up of these 200 day and 50-day moving averages.
- If you want to know the overall long trend of the market, then 200 day moving average is the best choice. If you find the price below the 200 day moving average, then assume that the overall trend is down, and if the price lies over the 200 day moving average, then the trend is up.
- As 200 day moving average is used worldwide by so many traders in various strategies, the predictions could become self-fulfilling and limit price growth.
- The 200 day moving average could be used as a curve line support and resistance zone. You can use this indicator as like as horizontal support and resistance.
Place buy trades using 200 day moving average
You can use 200 day moving average as the key support level of the forex market. Using this information in mind, you can take buy trades every time the price bounce off from the 200 SMA. But it would be best if you were very cautious because if you take every trade and count every bounce as a buying opportunity, you will lose many times. A live example could make you more clear.
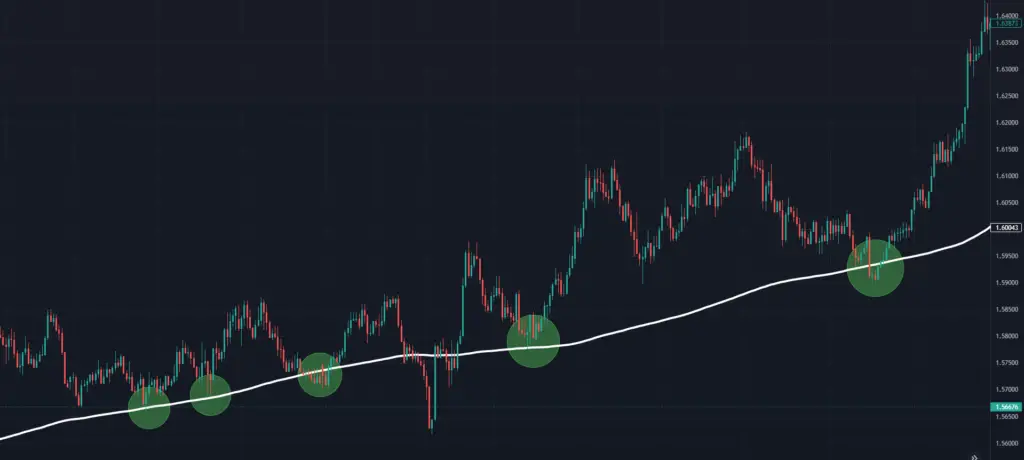
Look at how many times the price showed respect to 200 day moving average. Price comes to 200 day moving average and then bounces 5 times in a row. How many pips could you make if you could take all of these 5 trades? It’s a massive amount of pips. And more surprisingly, not even a single trade goes in the wrong direction. Every time the price bounces off from the 200 sma price rises.
Sell trade example on 200 day moving average strategy
When the price remains above the 200 day moving average and bounces back from it, place a sell trade then. Of course, there are good trades, and there are bad trades. You need to sort out good trades from bad ones.
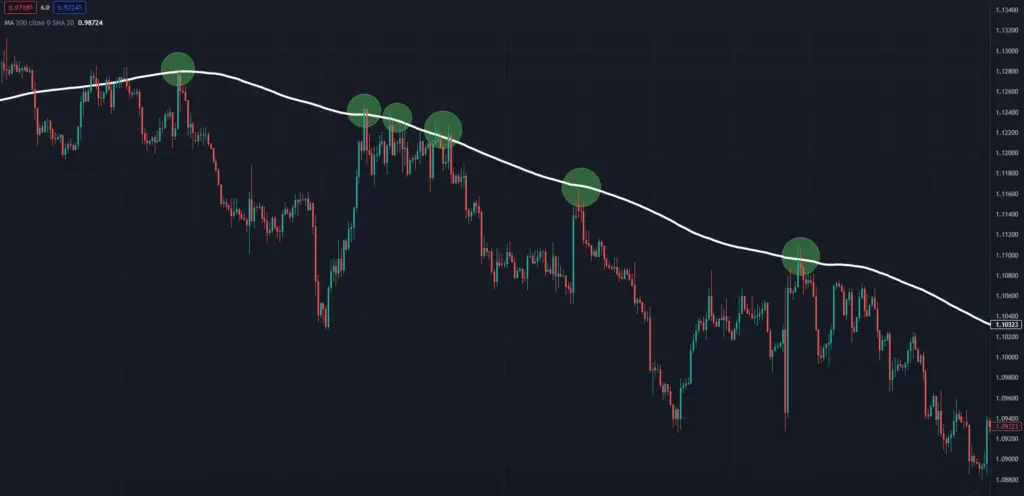
The price touches the 200 SMA and then falls. 6 times consecutively price touched the 200 SMA and respected it. Remember, your best opportunities lie in these areas. 200 moving average works here as a strong resistance zone.
Golden crosses and death crosses using 200 SMA
Bank traders and hedge fund traders use one secret strategy that many newbies don’t know. What’s that strategy? that strategy is called the golden cross strategy. They build this strategy by combining 2 different simple moving averages. One is 50 period moving average, and the other is 200 periods moving average.
When 50 SMA crosses over to the upside of the 200 SMA that crossover is called the golden cross. Traders tend to search for buy opportunities then. When 50 day SMA crosses to the downside of the 200 SMA, that cross is considered a death cross. Traders try top find sell opportunities, then
Buy 200 SMA golden crosses
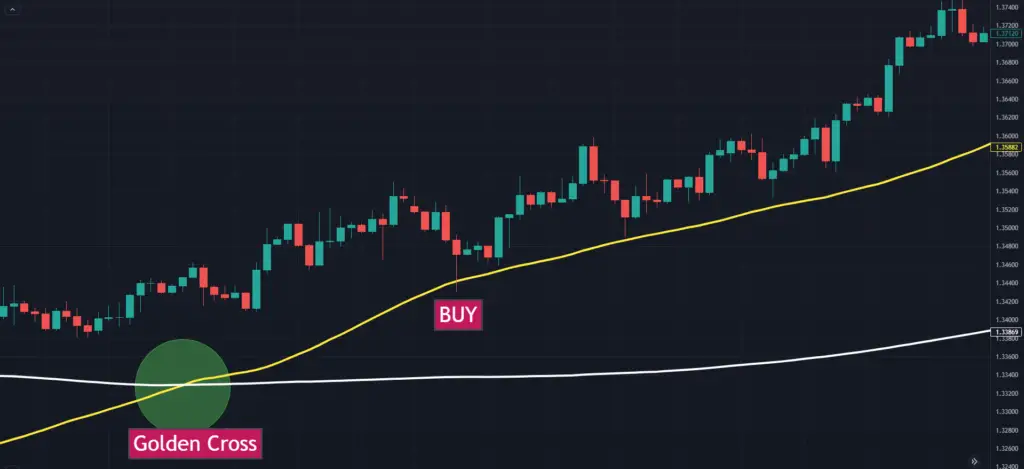
50 sma crosses 200 sma. The golden cross happens. Now you need to observe price behavior very closely. When the price comes back to 50 sma, you can buy from there. Or, if you are an aggressive trader, you can buy just after the golden cross.
Sell on 200 SMA death crosses
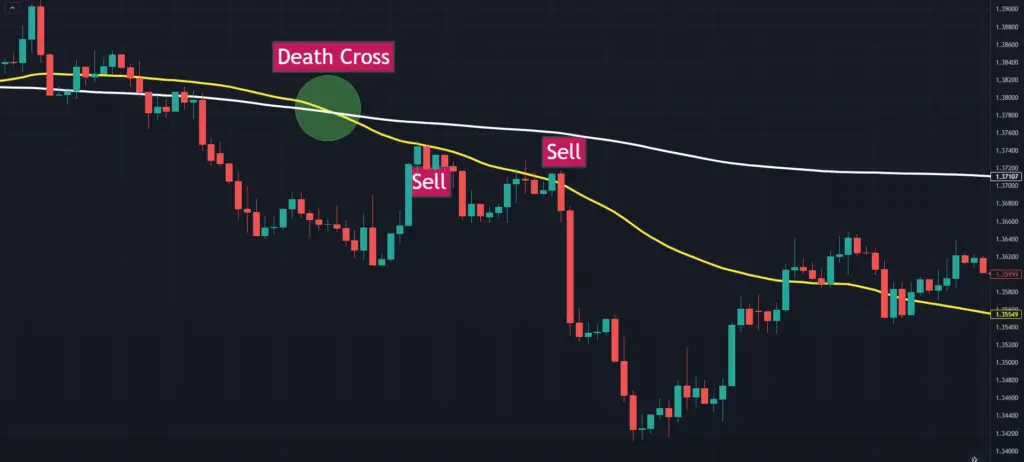
Aggressive traders will sell just after seeing the death cross. But conservative traders will wait for the price to return to 50 sma again. After the death cross, when the price goes back to 50 sma level, they put the sell trade. And it’s the best practice.
How to calculate moving average for 200 days
Sum up the closing prices for each of the last 200 days and divide that total by 200. you will get the 200 day simple moving average value. Isn’t it pretty simple?
200 day moving average formula= {day1+day2+day3……..+day200)/200}
Some disadvantages of 200 day moving average
I narrated all the benefits above. But there are some major disadvantages also. First, you will get only a few amounts of signals in this moving average. Although big banks stick to 200 day simple moving averages, you can slightly modify them as a retail trader. You can apply 200 periods of simple moving average in 4 hours and 1 hour. But if you do that, do it at your own risk.
The second disadvantage is that the moving average is a lagging indicator. So 200 period is no different. If you trade based on 200 SMA, you depend on a lagging indicator.
Final Talk
Moving averages are useful in trendy markets. You will get many profitable setups in the uptrend or in the downtrend. But in a sideways market, the moving average can often give false signals. If you want to trade like big banks and hedge funds, you must also think and act like them.
Big banks and hedge funds don’t catch every trades they get from the strategy. They filter out good trades from bad ones. They also follow strong money management rules. If you can stick to your trading strategy, trading rules, and money management, then you can also produce profits using 200 day simple moving average. It could be a gem for you if you know how to use it.
