
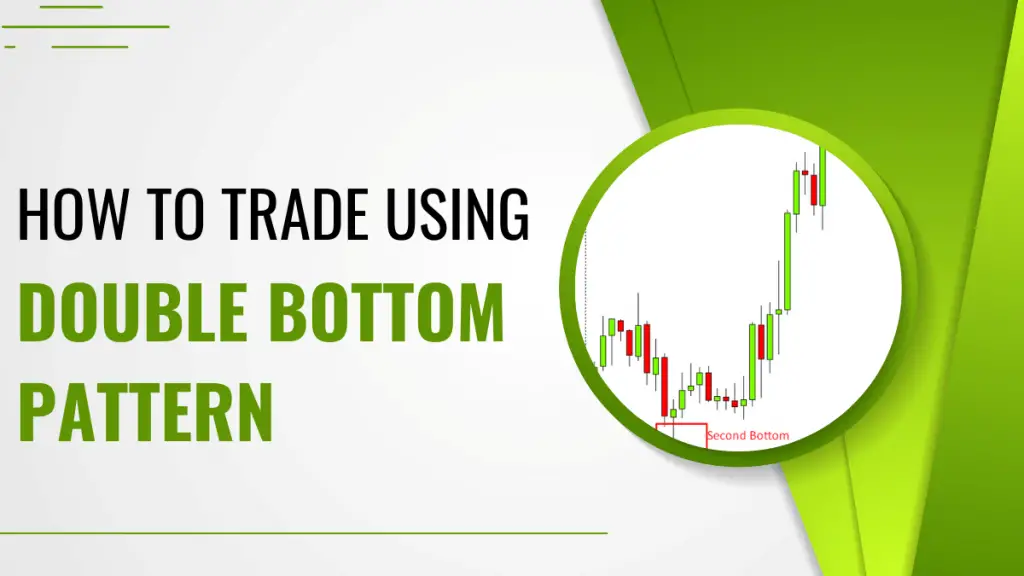
The double bottom pattern is a chart pattern. It indicates the change in the trend direction. So we can call it a trend reversal pattern or formation. Interestingly, the Double bottom pattern looks like the English alphabet “w.”
If found at the bottom of a downtrend, this bullish reversal pattern indicates that the buyers are taking control from the sellers.
Now I will describe How easily you can identify double bottom patterns and how you can trade successfully using this pattern.
Double Bottom Chart Example
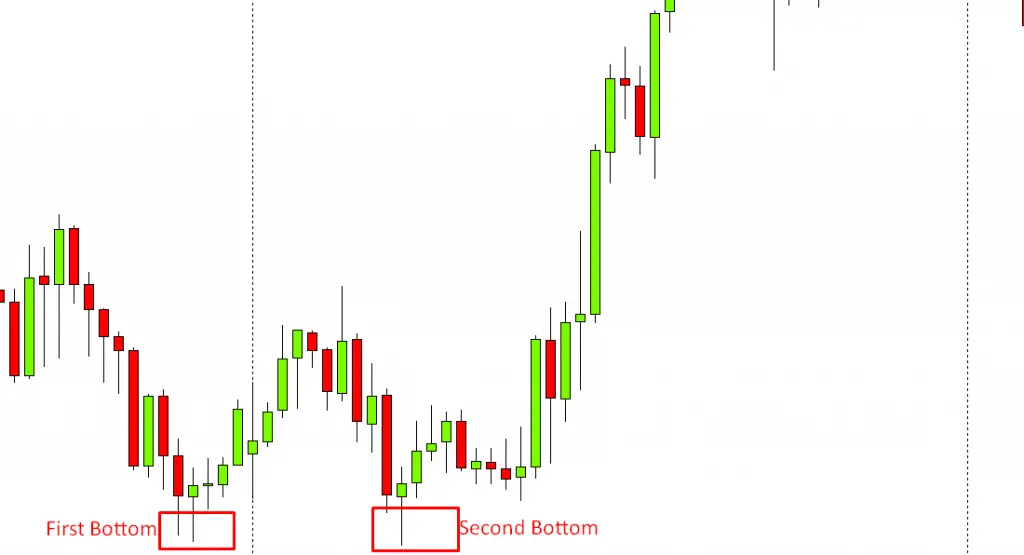
Look at the picture. Price was in a downtrend. Then we find two valleys or bottoms—one after another. The second bottom didn’t break the first bottom. A certain line is held, and this is the double bottom line. What does it imply? As a trader, we will interpret this scenario as the sentiment is shifting from sellers to buyers. The market is now under the control of buyers instead of sellers. The huge selling pressure is about to finish. Thus a reversal will occur.
Trade Double Bottom pattern conservatively and professionally
To trade double bottom patterns more professionally and conservatively, you must be patient. You need to wait until the market gives you a neckline, and when the price breaks, the neckline only then enters the market. If you enter the market before breaking the neckline, you will lose many times, and your balance will not grow. Although you will get fewer trade setups in these aggressive setups, remember the setups you will get such way will all be successful setups. Chances are huge that most of the trades will be profitable trades.
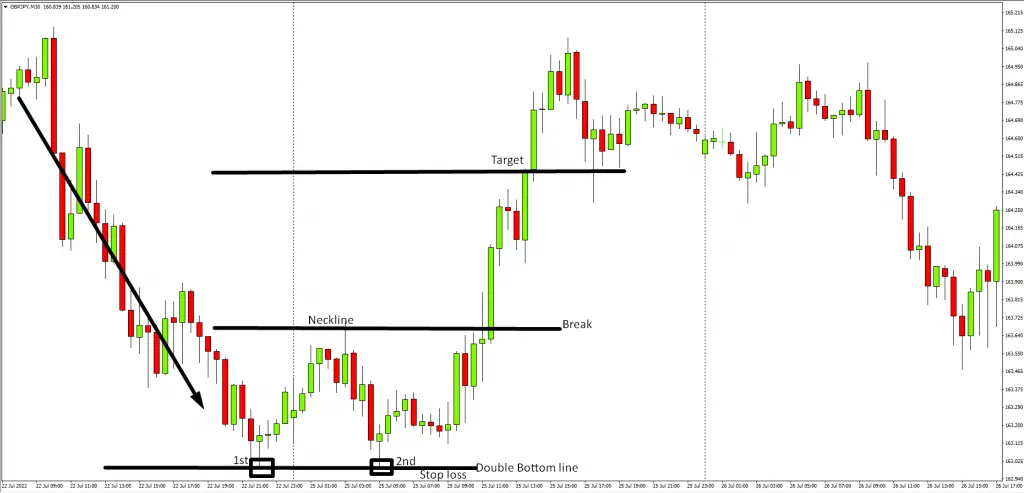
Look how beautifully price breaks the neckline and hits your 1: 1 profit target. Place your stop loss below the double bottom line. Look how healthy the breaking neckline candle is. Your success with these types of setups relies on picking up the proper setups. Always choose the setups in which the neckline is broken up robustly.
Trade Double Bottom pattern Aggressively
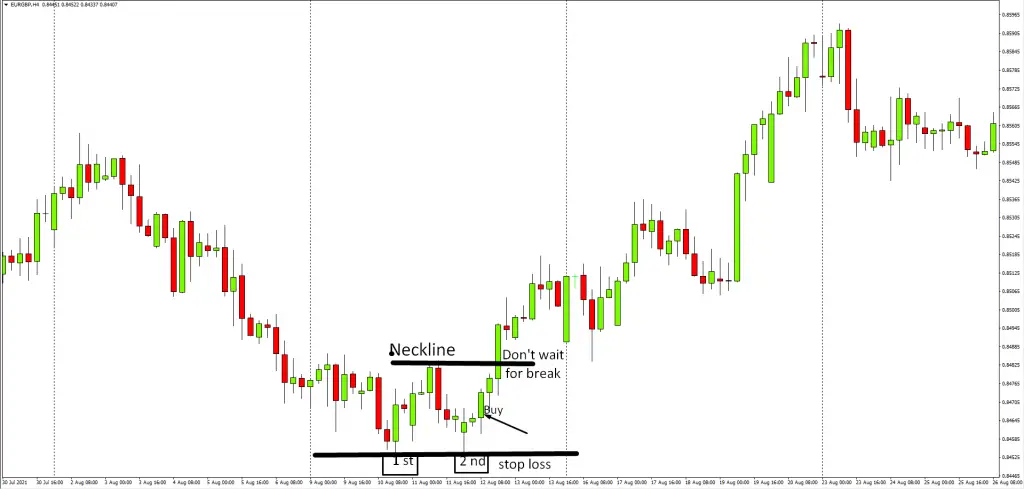
In these types of entries, traders need not wait to break the neckline. Rather after the formation of the second bottom, they wait for any healthy bullish bar. If found, then enter the market. As they enter early, they make a profit many times, but the problem with this method is often market back again without breaking the neckline and then fall again.
But when you see the neckline broken, you could be sure that the buyers are taking control of the market. So, I personally don’t suggest this method. If you are a double bottom pattern lover and want to trade with this type of pattern, then I recommend sticking to the conservative method only.
Drawbacks of Double Bottom pattern
Technical analysts hardly find any limitations of double bottom formations except the pattern identifying process. This pattern could be highly profitable if you can correctly identify the pattern, place the target, and stop loss at the right points. But This pattern could be highly faulty if you can’t detect the pattern the right way.
1. What is a double bottom pattern?
A double bottom pattern is a trend reversal pattern in trading. First, a drop in currency price happens then we find a little pullback. After that price drops to the same level again, this is the basic definition of a double bottom pattern. Buyers prepare to place buy orders getting this type of pattern.
2. Is double bottom pattern bullish?
Yes. Double bottom pattern is a Bullish pattern.
3. How do you play a double bottom pattern?
You play two ways to a double bottom pattern. You can wait to break the neckline and then enter the market, which is a more professional and conservative method. Or you can enter when the second bottom is created, which is an aggressive entry.
4. How reliable is double bottom pattern?
The double bottom pattern is a reliable trend reversal formation if you catch the proper formation. It could be very detrimental if you catch the wrong pattern incorrectly.
5. What happens after double bottom pattern?
The double bottom pattern is a bullish trend reversal pattern. It indicates sellers are taking control of the market. After this pattern, currency prices or index or stock prices rise. This is a buy signal. If you find this type of formation, you should make the buying decision.
