
Accumulation/distribution indicator mt4 is one kind of indicator which measures the volume of the market. Marc Chaikin first developed this indicator to help himself select the right stocks. In the forex market, many aspiring analysts use this tool to shine their trading. There are many renowned traders like akil stokes who use accumulation/distribution index. just check akil stokes net worth and you will get the answer to why he use this tool.
How to identify accumulation and distribution & What AD indicator measures?
When we set any period, the Accum/dist oscillator observes the trading range and volume. Then collecting data from this accumulation distribution indicator mt4 measures the flow of money added or disbursing from a particular financial instrument. There are three main steps in this whole calculation process.
Firstly, this accumulation distribution forex indicator calculates the close location value. The close location value correlates to the closing price for any given time frame, price range over that time frame. The close location value can vary from -1 to +1.
Suppose the period’s closing is also the low of that time, then the CLV will be counted as -1. On the contrary, if the closing price is high for that period, the CLV value will be +1.
These two points, means -1 and +1 are the extreme points or values. If the indicator finds any other values, then the CLV will remain somewhere between -1 to +1.
So the CLV = {(close -low)-(high-close)}(high-low)
Secondly, the CLV will be multiplied by the period we set on. We can get the money flow measurement with this step. If we get any positive value, that means money is going in, and if we get any negative value, that means money is going out.
Here, money flow=CLV× volume
Thirdly, we will calculate this value over multiple periods.
Our A/D value = previous A/D value +current value for [CLV × volume]
In short, we can conclude that this indicator amounts to a running total of money flows in and out of any specific instrument.
Have you ever been worried ? or felt disgusted thinking that how could I measure these mathematical terms easily! Don’t get confused and don’t feel complicated! We have every solution for this situation.
You don’t need to do these complicated mathematical calculations manually. There is a built-in accumulation/distribution indicator mt4 in the charting platform. It’s completely free, which you will get on your chart.Here i am giving an accumulation distribution chart
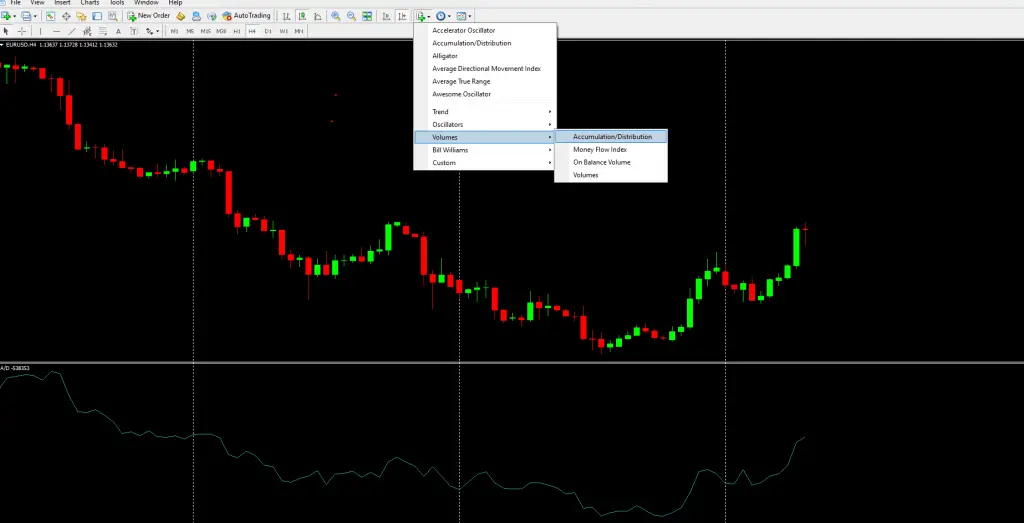
Just select the indicator, and it will be applied to your chart automatically. Here I am giving you an image of how you can find the indicator.
After applying the indicator, you will get a view like this chart.
How you can use accumulation pattern & distribution pattern
The Accumulation distribution line represents the supply and demand of the market. As we mentioned earlier, it measures the ongoing and outgoing money flow.
Whether there is buying or selling pressure, we can get clues from this indicator.
If you detect that the indicator line is rising, then be sure that buying pressure is dominant for our chosen instrument. We call this situation the accumulation. If we detect that the line is falling, then be sure that selling pressure is dominant in the market. We call this situation distribution.
Accumulation/distribution indicator mt4 Strategy
We can use this indicator as a divergent strategy. This means if the price is falling and the accumulation and distribution indicator is rising, that is a bullish reversal pattern. we can assume that if we open a buy order, then we will make a profit as the huge bullish pressure is forthcoming
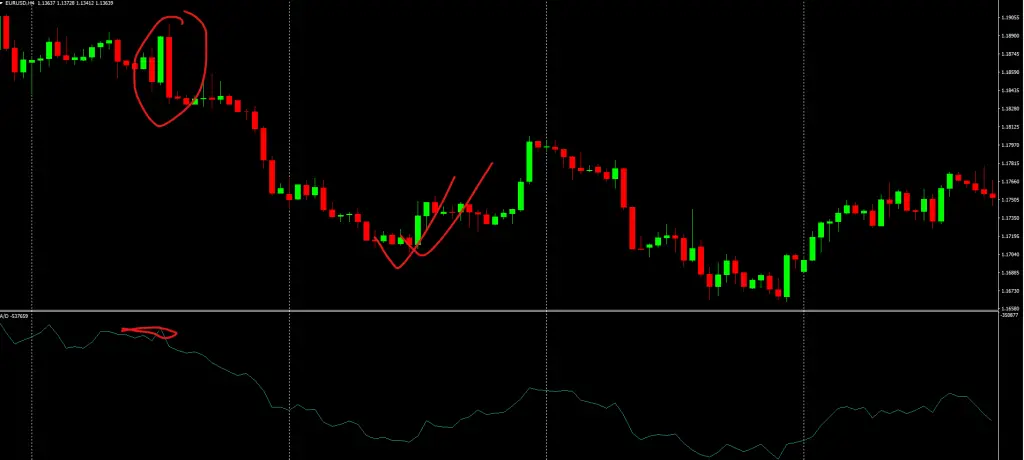
If the price is rising and the accumulation/distribution indicator mt4 is falling, then that is a bearish reversal pattern. If we open a sell order, the chance is huge that we will profit as the massive selling pressure is awaited. This accumulation distribution strategy is very powerful if you apply the strategy in busy hours like London and US sessions
How to use accumulation/distribution indicator mt4 and the Limitations of it
These are drawbacks to every indicator. As an indicator, the accumulation distribution index is no different. The accumulation/distribution line focuses on where price closes which results in abnormality. Suppose a stock, for say Apple, gaps down 30 % on massive volume. The price fluctuates the whole day and finishes in the upper portion of its daily range, but it is still down 28 %from the previous close. This particular move actually causes the accumulation distribution oscillator to rise.
Even Apple stock lost a compelling amount of value, but as it ends in the upper portion of its daily range, the indicator will increase. Most of the time, traders like us, when monitoring the price chart, spot these abnormalities.
One more limitation is when we trade divergence with this index; divergences sometimes last a long time, creating poor signals. Traders enter early in many trades. That’s why I recommend all to use the A/D indicator in association with other forms of analysis. Like price action analysis or chart pattern analysis would be a great choice.
On balance volume (OBV) vs. accumulation distribution (AD)
Although there are tiny differences, Both OBV and AD use volume and price. “On Balance Volume” looks at whether the current closing price is lower or higher than that of the previous price closing. OBV adds volume if the closing price is higher. OBV subtracts volume if the closing price is lower.A/D doesn’t count whether the prior close is higher or lower. Rather it uses a multiplier counting on where the price closed within that fixed time frame’s range. Thus A/D uses different calculations and provides different data to us.
Conclusion
Although there are many custom indicators, if you combine the above tool with 3 level zz semafor then you will get the best output. If your balance is low then for testing purposes you can start forex 0.01 lot size and apply the strategy. When you get confident then you could invest more money and increase your lot size.
Some more strategies using custom indicators
- Auto fibo trade zone indicator for 2022
- How to trade forex using 1 2 3 pattern indicator
- Non repaint reversal indicator mt4 free download
- Best currency strength meter for 2022
- Automatic support and resistance indicator mt4
- 3 level zz semafor indicator for 2022
- 3 ducks trading system for 2022
- 2 line macd indicator for mt4
