50 day moving average more specifically 50 day simple moving average is popular among traders and technical analysts worldwide. Have you ever ask yourself why ? There are various types of moving averages and various periods moving average then why 50 period is such important and such popular?
The answer is pretty simple. As 50 day moving average is used worldwide by so many traders so the predictions could become self-fulfilling. We bank traders and hedge funds analysts also use golden cross and death cross system. And 50 moving average is used combined with 200 moving average in both golden and death cross. As 50 day moving average is used by bank and hedge funds traders so it becomes most popular forms of moving average.

Moving average is a trend following indicator
What is the 50 day moving average – (50 SMA)
50 day simple moving average represents the daily closing prices of currency pairs like GBPUSD, EURUSD, and so on. It is the average price over the past 50 days. It is something like a curve trendline. It weighs the same day’s closing price, so it is called a simple moving average.
Traders worldwide use mostly 100 moving averages, 200 moving averages, and 50 moving averages. So 50 period moving average is the leading average of the most used moving average.50 MA is shorter than 100 and 200 MA, representing the first line of moving average curve line support and resistance.
Characteristics of an ideal moving average
An ideal moving average is a moving average respected by price data. More specifically, if the price doesn’t violate any moving average randomly, then it is an ideal moving average.
When temporary retracements and false reversals happen in the market, the moving average goes broke and is violated many times. But an ideal moving average will be respected in most of these false cases. As 50 day moving average is not violated in these cases most of the time. Additionally, you can increase your profit by entering multiple positions when the price comes to 50 moving average and gets rejected from it every time. So you can add more positions in addition to your existing position.
All the characteristics of an ideal moving average are present at 50 day moving average, so we can say that 50 moving average is an ideal moving average.
How to use 50 day moving average understanding uptrend and downtrend
If the 50 day simple moving average stays above the 100 day moving average and the price remains above 50 SMA, then you can assume that the trend is up.
Similarly, if 50 day moving average remains below the 100 SMA and the price remains below the 50 day moving average, then you can understand that this is a downtrend.
If you are a short-term trader, use 50 day exponential moving average and for a long-term trader, use 50 day simple moving average to interpret the market trend properly.

Observe the market when there is high liquidity and volume. If the price breaks below 50 moving averages and can’t rally back in a high volatility session, then assume that the downtrend begins—time to sell.
Important factors of 50 day moving average
- The currency pair is bullish if the price remains above 50 day moving average.
- The currency pair is bearish if the price remains below 50 day moving average.
- Take a buy entry if the price bounces back upwards from the 50 day moving average.
- Take a sell entry if the price returns downwards from the 50 day moving average.
- If the price breaks strongly 50 day moving average, then stay away from the market. First, let the price settle, then understand the market conditions open positions.
50 day moving average strategy
50 SMA makes various strategies, but I will give you one advanced and conservative system here. If you master this simple but powerful strategy, you won’t need to search for any holy grail of forex. Practice this simple strategy, and money will come like rain.
Buy entry in 50 day moving average strategy
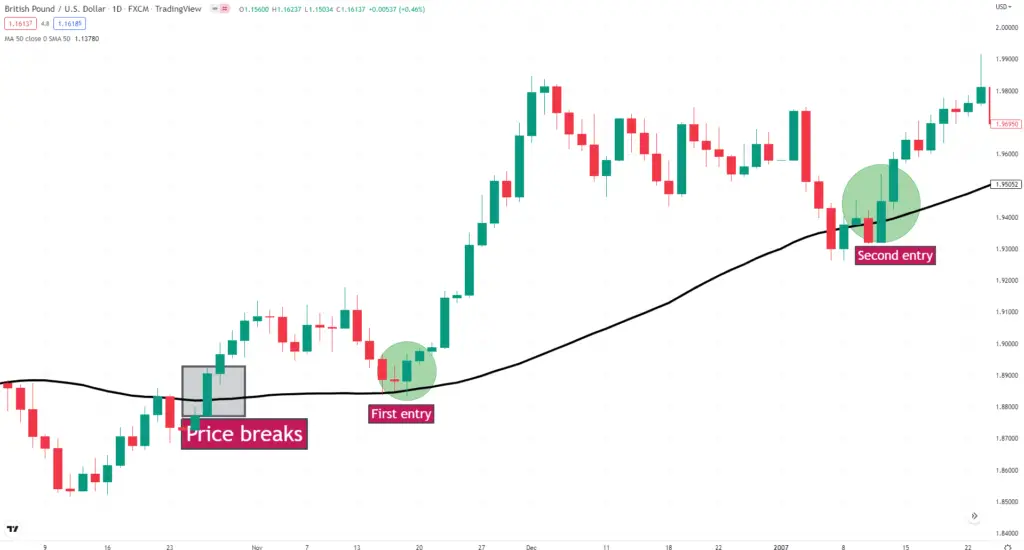
Whenever the price breaks 50 day moving average, observe the market closely. Most of the aggressive newbies will open trades just after seeing the breaks. But as a professional trader, you should not do the same. Wait for the price comes back to 50 day simple moving average again. Open a buy trade if the price comes near 50 SMA or gets rejected from the 50 SMA. Let me give an example so that you will understand more clearly.

Here price first breaks 50 day simple moving average. Wait. Keep patient. Be a conservative trader. Wait for the price to retrace back again. Open a buy trade when the price comes back for the first time after breaking the sma. You get multiple opportunities sometimes to open positions. You can open another trade when the price retraces again for the second time near 50 SMA. Isn’t it simple?
Sell entry using 50 day moving average

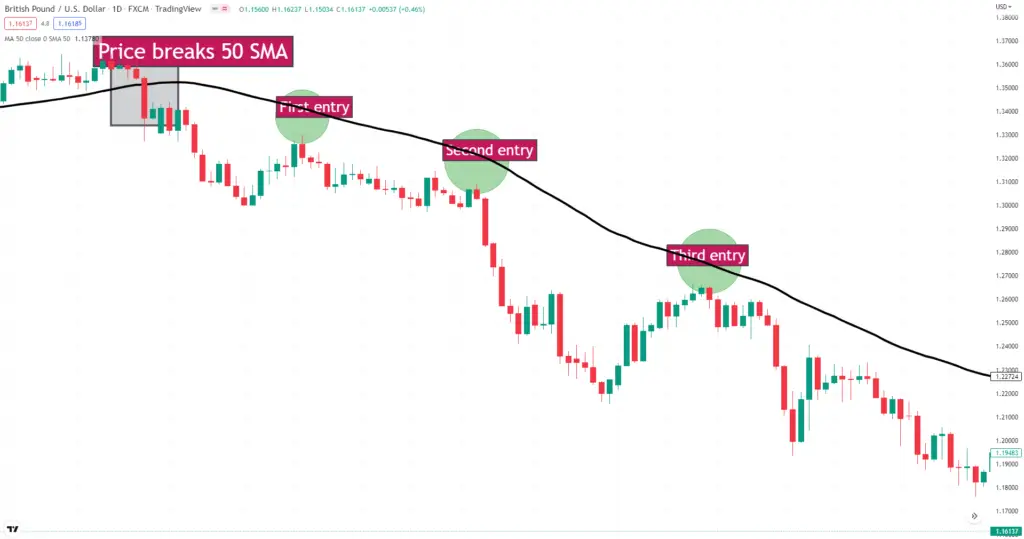
Take a look at the chart. Price first breaks the 50 day moving average. Don’t open trade here. Wait for the price to come again near 50 SMA. After taking your first trade, wait for the second and third entries. That means every time the price retraces back to 50 sma, just observe if there is any selling pressure or not. If you find selling pressure, then open trades.
Take profit and stop loss method of 50 day moving average strategy
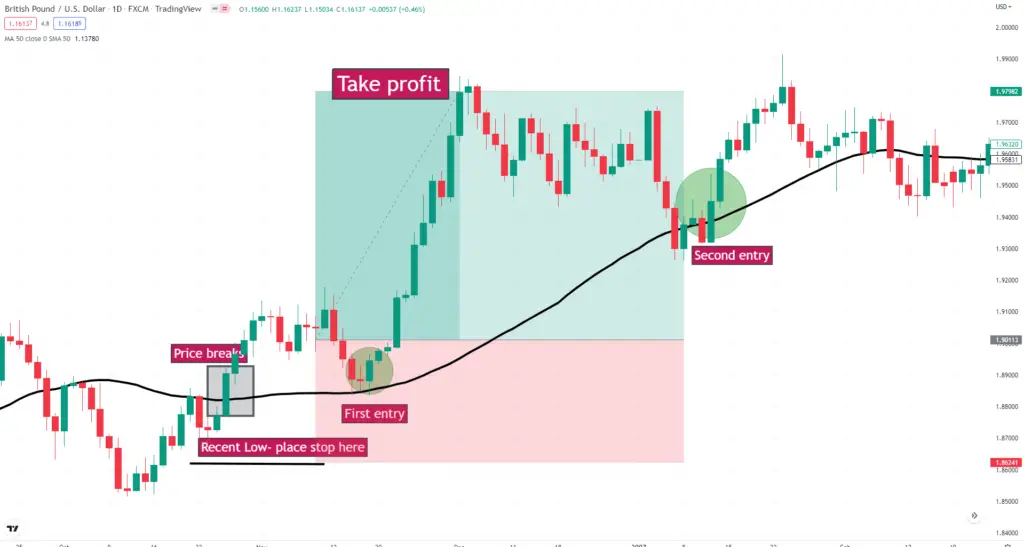
Set your stop loss just below the recent low for the buy entry and above the recent high for the sell entry. Remember, recent highs and lows are very strong zones, and in most cases, I don’t observe the market breaking these zones. So you can relax placing stop loss in these points.
Get out from the market just taking a 1: 2 risk reward. If you are a profitable trader, then 1:2 is more than enough for you to grow your capital consistently. But be careful if the price breaks 50 sma strongly; then it is better to close your positions and stay away from the market.

50 moving average used in the golden cross & death cross strategy
Bank and hedge fund traders use the golden cross and death cross strategies. Most of the time, these institutional traders don’t lose money in trading. Don’t you surprise why? Because they use this secret golden cross and death cross. And 50 day moving average is used in that golden and death cross strategy. If you are also a conservative trader and trade only a handful of trades and want to grow your capital slowly but surely, then you also trade using the Golden crosses and death crosses strategy.
Limitations of 50 day moving average
All the moving averages use historical data, and 50 period moving average is no different. What does it mean? It means 50 day SMA responds slowly even after the price reacts quickly.
Although most of the time market tends to follow and respect moving average support and resistance, sometimes it does not. When the market does not respect 50 MA, then it’s hard for newcomers to make decisions about what they should do. Most of the time, newcomers can’t make the right decisions to buy or sell and lose money.
50 day moving average tends to perfect well in trendy markets and sessions like London sessions, US sessions, and overlap sessions of London and us. That’s why I don’t recommend traders to open trades in any choppy markets like the late Asian session. I also don’t recommend trading some choppy pairs also like NZDCAD, NZDCHF, and so on.

In a highly volatile session, if the price breaks above 50 moving averages and can’t come back, then understand that the uptrend begins. Prepare to buy the pair.
Top market analyst’s quotes about 50 day moving average
“50 day moving average can also be used to place a trailing stop on an existing market position.”J.B. MAVERICK
“The only difference between a 50-day moving average and a 200-day moving average is the number of time periods used in the calculation.” CASEY MURPHY
“In the equity market, the 50-day moving average will be an important metric to watch”Craig Johnson, Chief Market Technician at Piper Sandler
